- Analytics
- News and Tools
- Market News
- Gold Price Forecast: XAU/USD recovers firmly as Chinese marshals restrict unrest, US GDP in focus
Gold Price Forecast: XAU/USD recovers firmly as Chinese marshals restrict unrest, US GDP in focus
- Gold price has extended its recovery above the $1,750.00 hurdle as the risk-off impulse eases.
- A recovery in risk-on profile has failed to ease US Treasury yields gains.
- United States inflation will face significant heat on a slowdown in growth rate.
Gold price (XAU/USD) has extended its recovery above the immediate hurdle of $1,750.00 in the Asian session. A responsive buying action around the critical support of $1,740.00 has marked a recovery in Gold price. The risk aversion theme is losing its grip, therefore, the US Dollar Index (DXY) has dropped sharply below 106.30.
S&P500 futures have displayed a recovery after a sell-off on Monday, indicating a recovery in investors’ risk appetite. Meanwhile, the 10-year US Treasury yields are holding their gains around 3.70%.
Chinese marshals have stopped the general public from coming to roads to weaken protests against the rollback of Covid-19 lockdown measures by the administration. Although, the process is temporary as individuals are filled with frustration and anger.
On the United States front, investors are awaiting the release of the quarterly Gross Domestic Product (GDP) data, which will release on Wednesday. The growth rate is expected to remain stable at 2.6%. Federal Reserve (Fed) policymakers brace for a slowdown in the growth rate as it will lead to a deceleration in inflation. This will be supportive of the Fed while designing a strategic plan for December’s monetary policy meeting.
Gold technical analysis
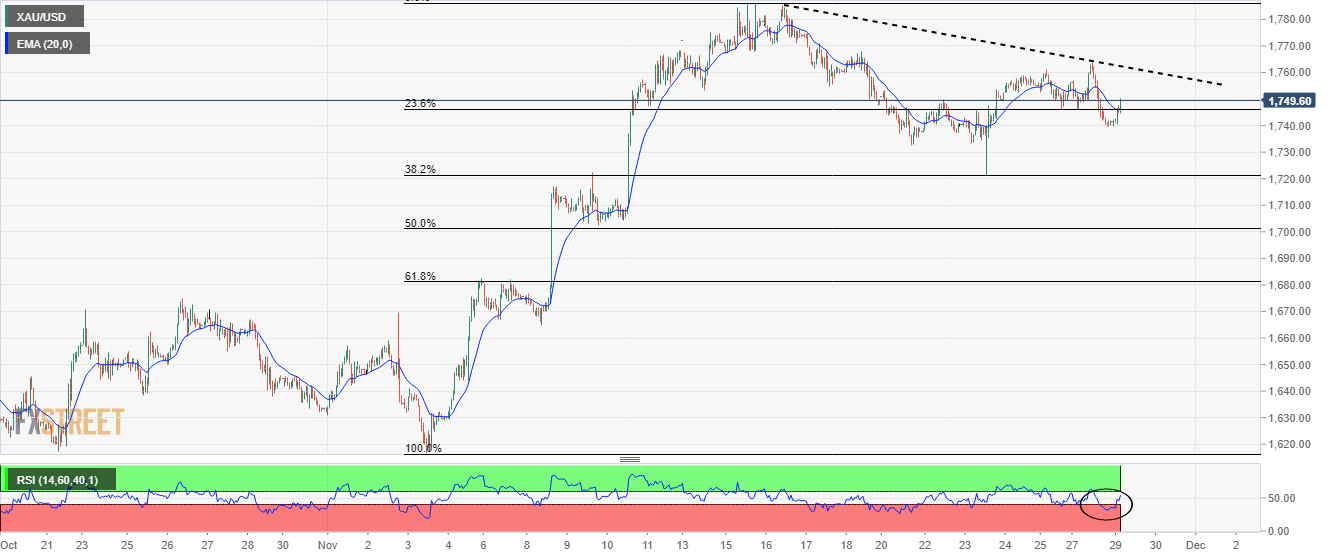
On an hourly scale, gold price has managed to recapture the 23.6% Fibonacci retracement (plotted from November 3 low at $1,616.69 to November 15 high at $1,758.88) at $1,746.50. The downward-sloping trendline from November 16 high at $1,784.42 will act as a major barricade for the gold bulls.
The precious metal has overstepped the 20-period Exponential Moving Average (EMA) at $1,746.00, which indicates that the short-term trend has turned positive again.
Meanwhile, the Relative Strength Index (RSI) (14) has shifted into the 40.00-60.00 range, which signals a consolidation ahead.
Gold hourly chart

© 2000-2026. All rights reserved.
This site is managed by Teletrade D.J. LLC 2351 LLC 2022 (Euro House, Richmond Hill Road, Kingstown, VC0100, St. Vincent and the Grenadines).
The information on this website is for informational purposes only and does not constitute any investment advice.
The company does not serve or provide services to customers who are residents of the US, Canada, Iran, The Democratic People's Republic of Korea, Yemen and FATF blacklisted countries.
Making transactions on financial markets with marginal financial instruments opens up wide possibilities and allows investors who are willing to take risks to earn high profits, carrying a potentially high risk of losses at the same time. Therefore you should responsibly approach the issue of choosing the appropriate investment strategy, taking the available resources into account, before starting trading.
Use of the information: full or partial use of materials from this website must always be referenced to TeleTrade as the source of information. Use of the materials on the Internet must be accompanied by a hyperlink to teletrade.org. Automatic import of materials and information from this website is prohibited.
Please contact our PR department if you have any questions or need assistance at pr@teletrade.global.


