- Analytics
- News and Tools
- Market News
- Gold Price Forecast: XAUUSD displays a subdued performance above $1,670 amid US Mid-elections buzz
Gold Price Forecast: XAUUSD displays a subdued performance above $1,670 amid US Mid-elections buzz
- Gold price is displaying a time-correction move as investors await fresh cues from US mid-term elections.
- The alpha generated by US government bonds is accelerating ahead of US CPI data.
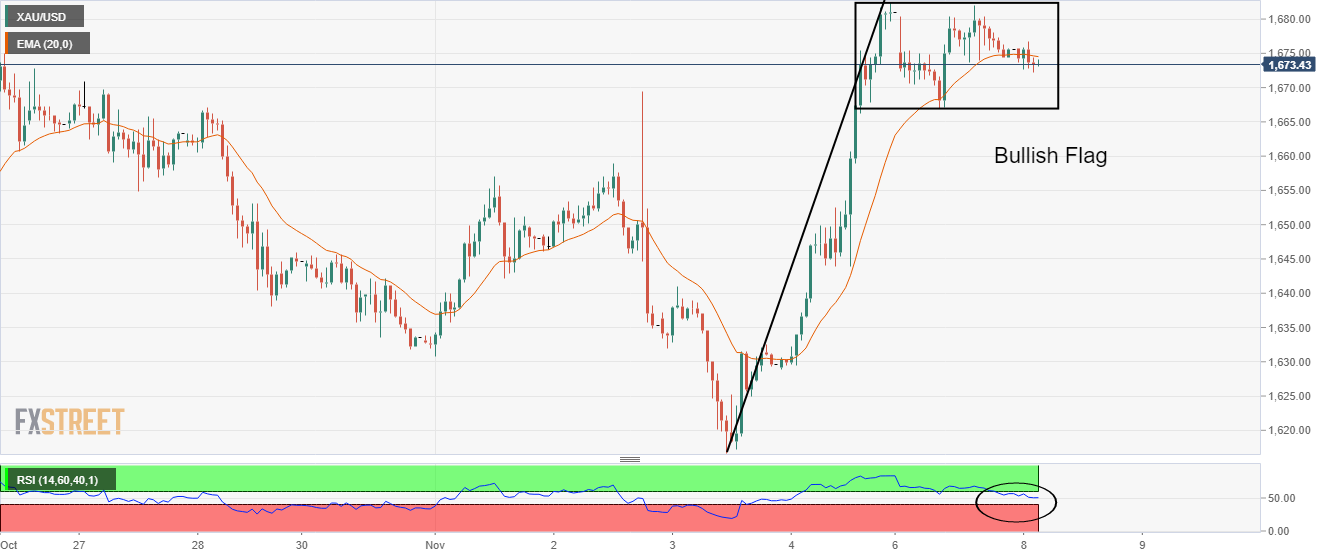
- A Bullish Flag formation is indicating a continuation of a rally after an upside break of consolidation.
Gold price (XAUUSD) has witnessed a time correction in the Tokyo session after struggling around the immediate hurdle of $1,680.00. The upside in the precious metal is capped by anxiety among investors ahead of the mid-term election buzz while the downside is being supported by overall optimism in the global market.
The US dollar index (DXY) has attempted a rebound after testing Monday’s low at around 110.00. Meanwhile, the 10-year US Treasury yields have climbed near 4.23% and are expected to continue their upside move ahead of US Consumer Price Index (CPI) data.
As per the preliminary estimates, the headline CPI is seen lower at 8.0% vs. the prior release of 8.2% while the core CPI that excludes oil and food prices is seen marginally lower at 6.5% against 6.6% in the prior release. The core inflation data has not displayed promising signs of exhaustion yet, therefore the extent of deviation in the catalyst will be keenly watched.
But before that, elections for 435 seats of the House of Representatives and 34 seats of the Senate will remain in focus. A majority win for Republicans could trigger political instability in the US economy and may impact gold prices.
Gold technical analysis
On an hourly scale, the asset is forming a Bullish Flag pattern that signals an impulsive bullish wave after the breakout of the consolidation. Usually, the consolidation phase indicates a most auctioned region where those investors place bets who prefers to enter an auction after the establishment of an upside bias. Also, investors add more longs as they see a continuation of the uptrend after a time-corrective pause.
The asset is hovering around the 20-period Exponential Moving Average (EMA) at $1,674.75. Meanwhile, the Relative Strength Index (RSI) (14) has slipped into the 40.00-60.00 range but that doesn’t warrant a reversal in the trend.
Gold hourly chart

© 2000-2026. All rights reserved.
This site is managed by Teletrade D.J. LLC 2351 LLC 2022 (Euro House, Richmond Hill Road, Kingstown, VC0100, St. Vincent and the Grenadines).
The information on this website is for informational purposes only and does not constitute any investment advice.
The company does not serve or provide services to customers who are residents of the US, Canada, Iran, The Democratic People's Republic of Korea, Yemen and FATF blacklisted countries.
Making transactions on financial markets with marginal financial instruments opens up wide possibilities and allows investors who are willing to take risks to earn high profits, carrying a potentially high risk of losses at the same time. Therefore you should responsibly approach the issue of choosing the appropriate investment strategy, taking the available resources into account, before starting trading.
Use of the information: full or partial use of materials from this website must always be referenced to TeleTrade as the source of information. Use of the materials on the Internet must be accompanied by a hyperlink to teletrade.org. Automatic import of materials and information from this website is prohibited.
Please contact our PR department if you have any questions or need assistance at pr@teletrade.global.


