- Analytics
- News and Tools
- Market News
- Gold Price Forecast: XAU/USD bulls are backed into a corner as US dollar corrects
Gold Price Forecast: XAU/USD bulls are backed into a corner as US dollar corrects
- The gold price is under pressure, forced back into a neutral zone on the daily chart.
- The hourly charts show that the price is balanced at a critical juncture.
- Investors look ahead to tomorrow's PCE and next week's Fed.
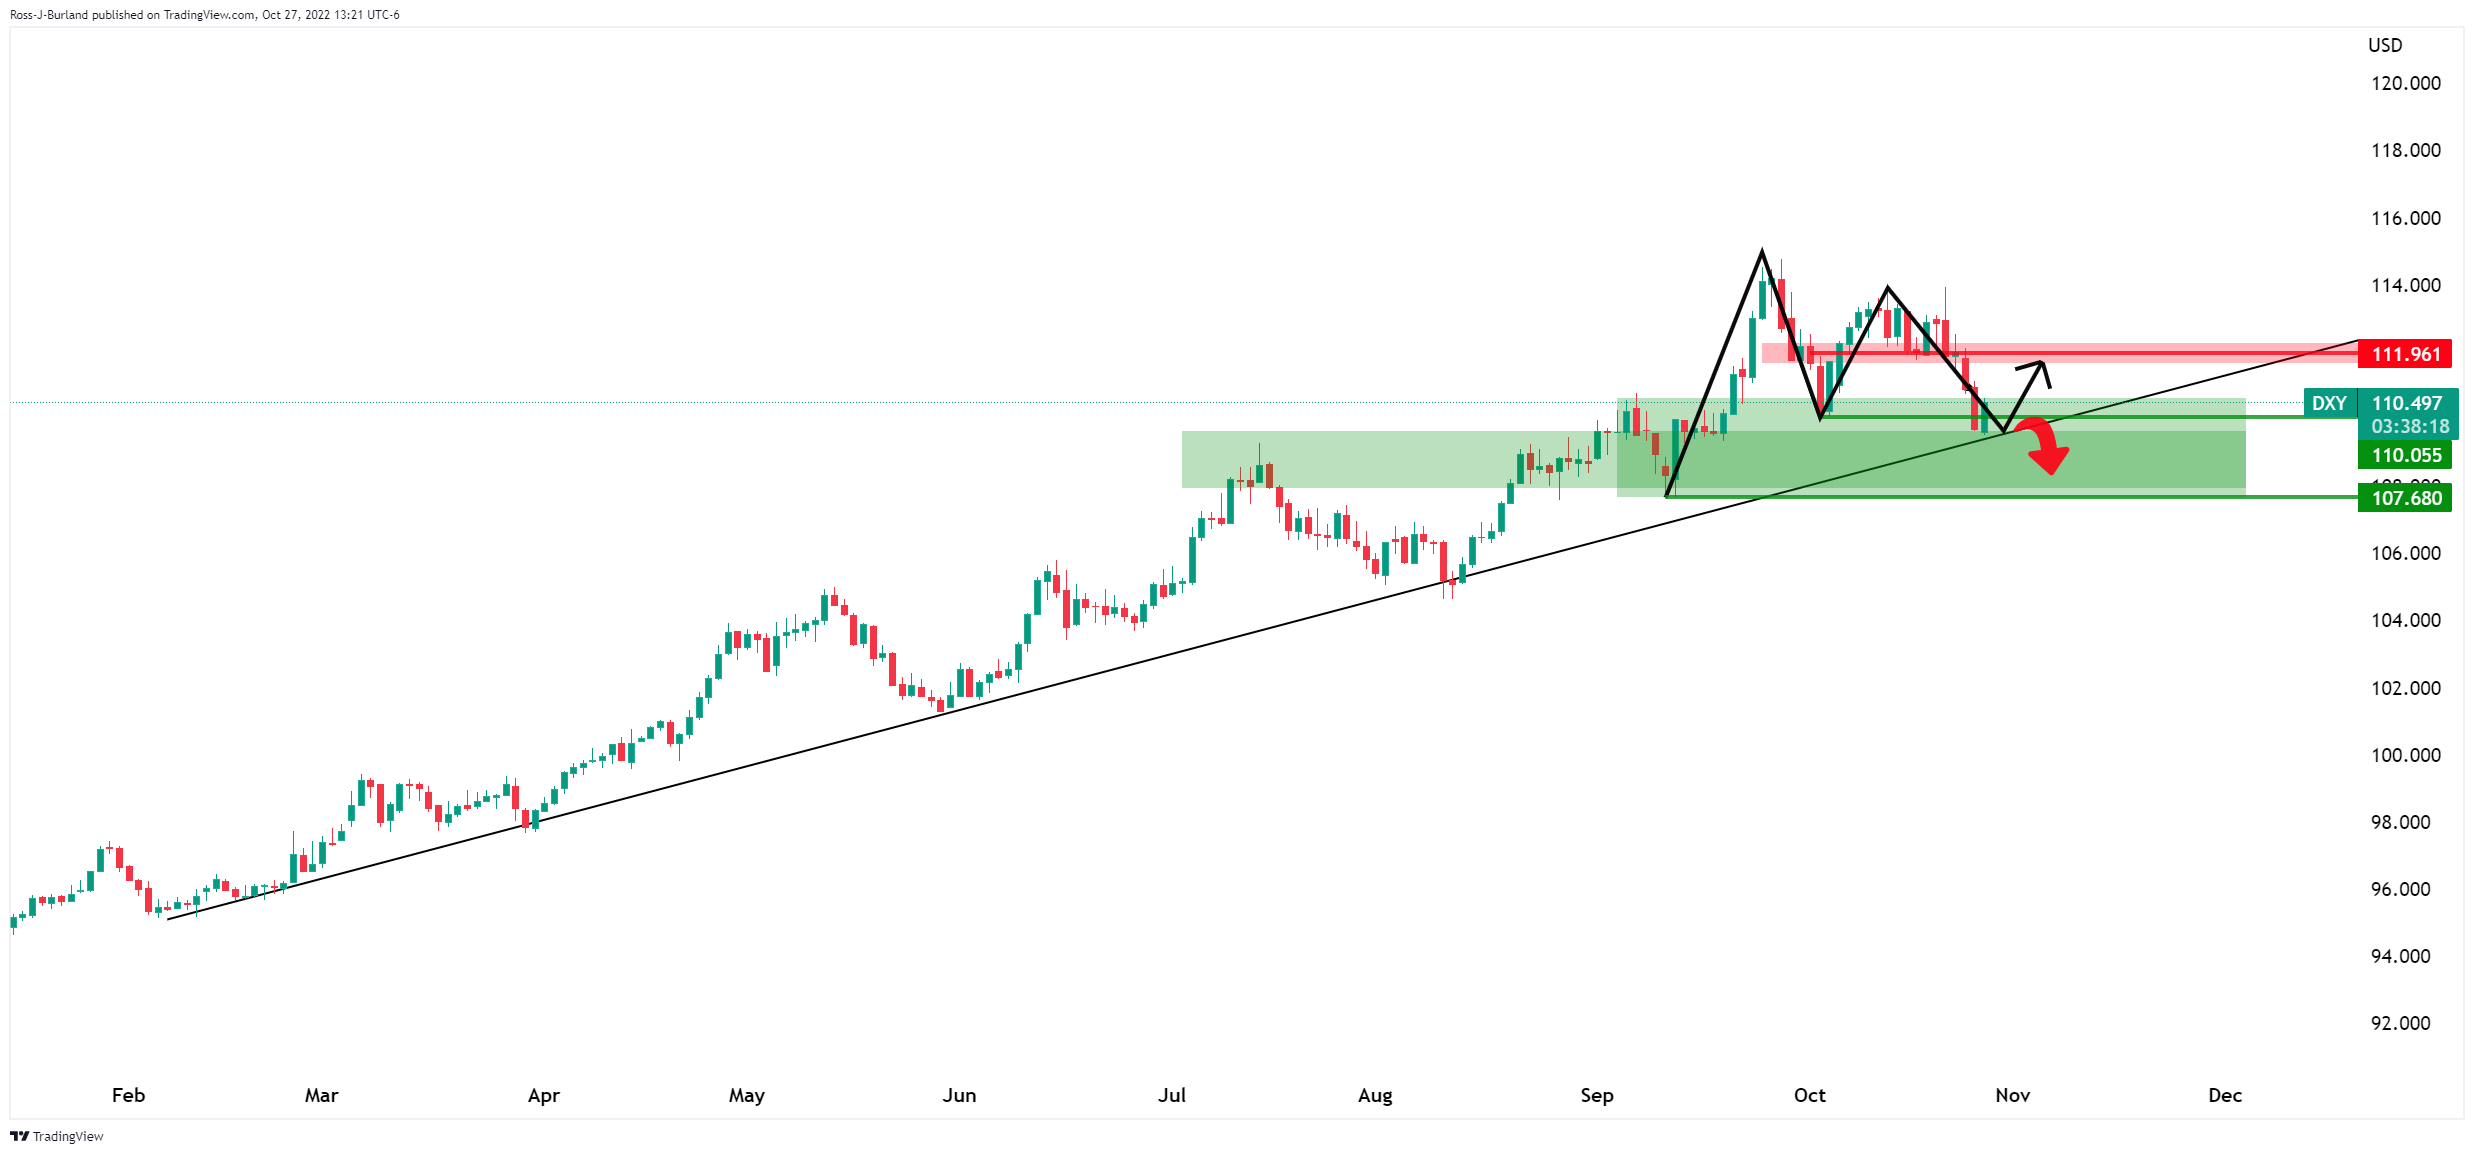
The price of gold has been pressured on Thursday in a resurgence in the US dollar that is correcting hard from a key daily supporting trendline as illustrated below by the DXY, an index that measures the greenback vs. a basket of major currencies. At the time of writing, the yellow metal is trading at $1,658 and down some 0.4% on the day. Gold has travelled between a high of $1,670.84 to a low of $1,654.89 so far., crucially failing to hold above a key resistance level on the daily chart.
The dollar index regained ground to above 110, boosted from the lowest level in over a month from both a technical basis in a move that started to show up on the charts ahead of key growth data from the US economy and the European Central Bank meeting. Gross Domestic Product data for the US has shown that the US economy is faring better than expected. It grew an annualized 2.6% on quarter in the three months to September of 2022, more than market expectations of 2.4% and rebounding from a contraction in the first half of the year. This has ended two straight quarterly decreases in output, which had raised concerns that the economy was in recession.
Meanwhile, the ECB raised all of its key policy rates by 75bp. The main refinancing rate is now at 2.0%. ''That is a level some officials at the ECB think approximates with longer-run neutrality, assuming inflation over time will return to 2.0%,'' analysts at ANZ Bank argued. ''But inflation is miles from that currently and further rate rises will be warranted. We are currently forecasting an additional 150bp of hikes. We think the ECB may dial down to 50bp hikes from December.''
Additionally, Lagarde's gloomy outlook for the economy has boosted an appetite for the US dollar as being regarded as the cleanest shirt in the laundry basket of currencies. The data and ECB falls ahead of tomorrow's PCE and next week's Federal Reserve meeting whereby the central bank is expected to raise rates at its Nov. 1-2 meeting by 75 basis points to 1.5%, a 13-year high. It is also likely to reel in a key subsidy to commercial banks.
However, there was a technical bounce in the greenback following its slide in recent days as investors started to cheer signs that the US Federal Reserve is considering slowing down its aggressive rate hikes in December:
DXY weekly chart

Gold technical analysis

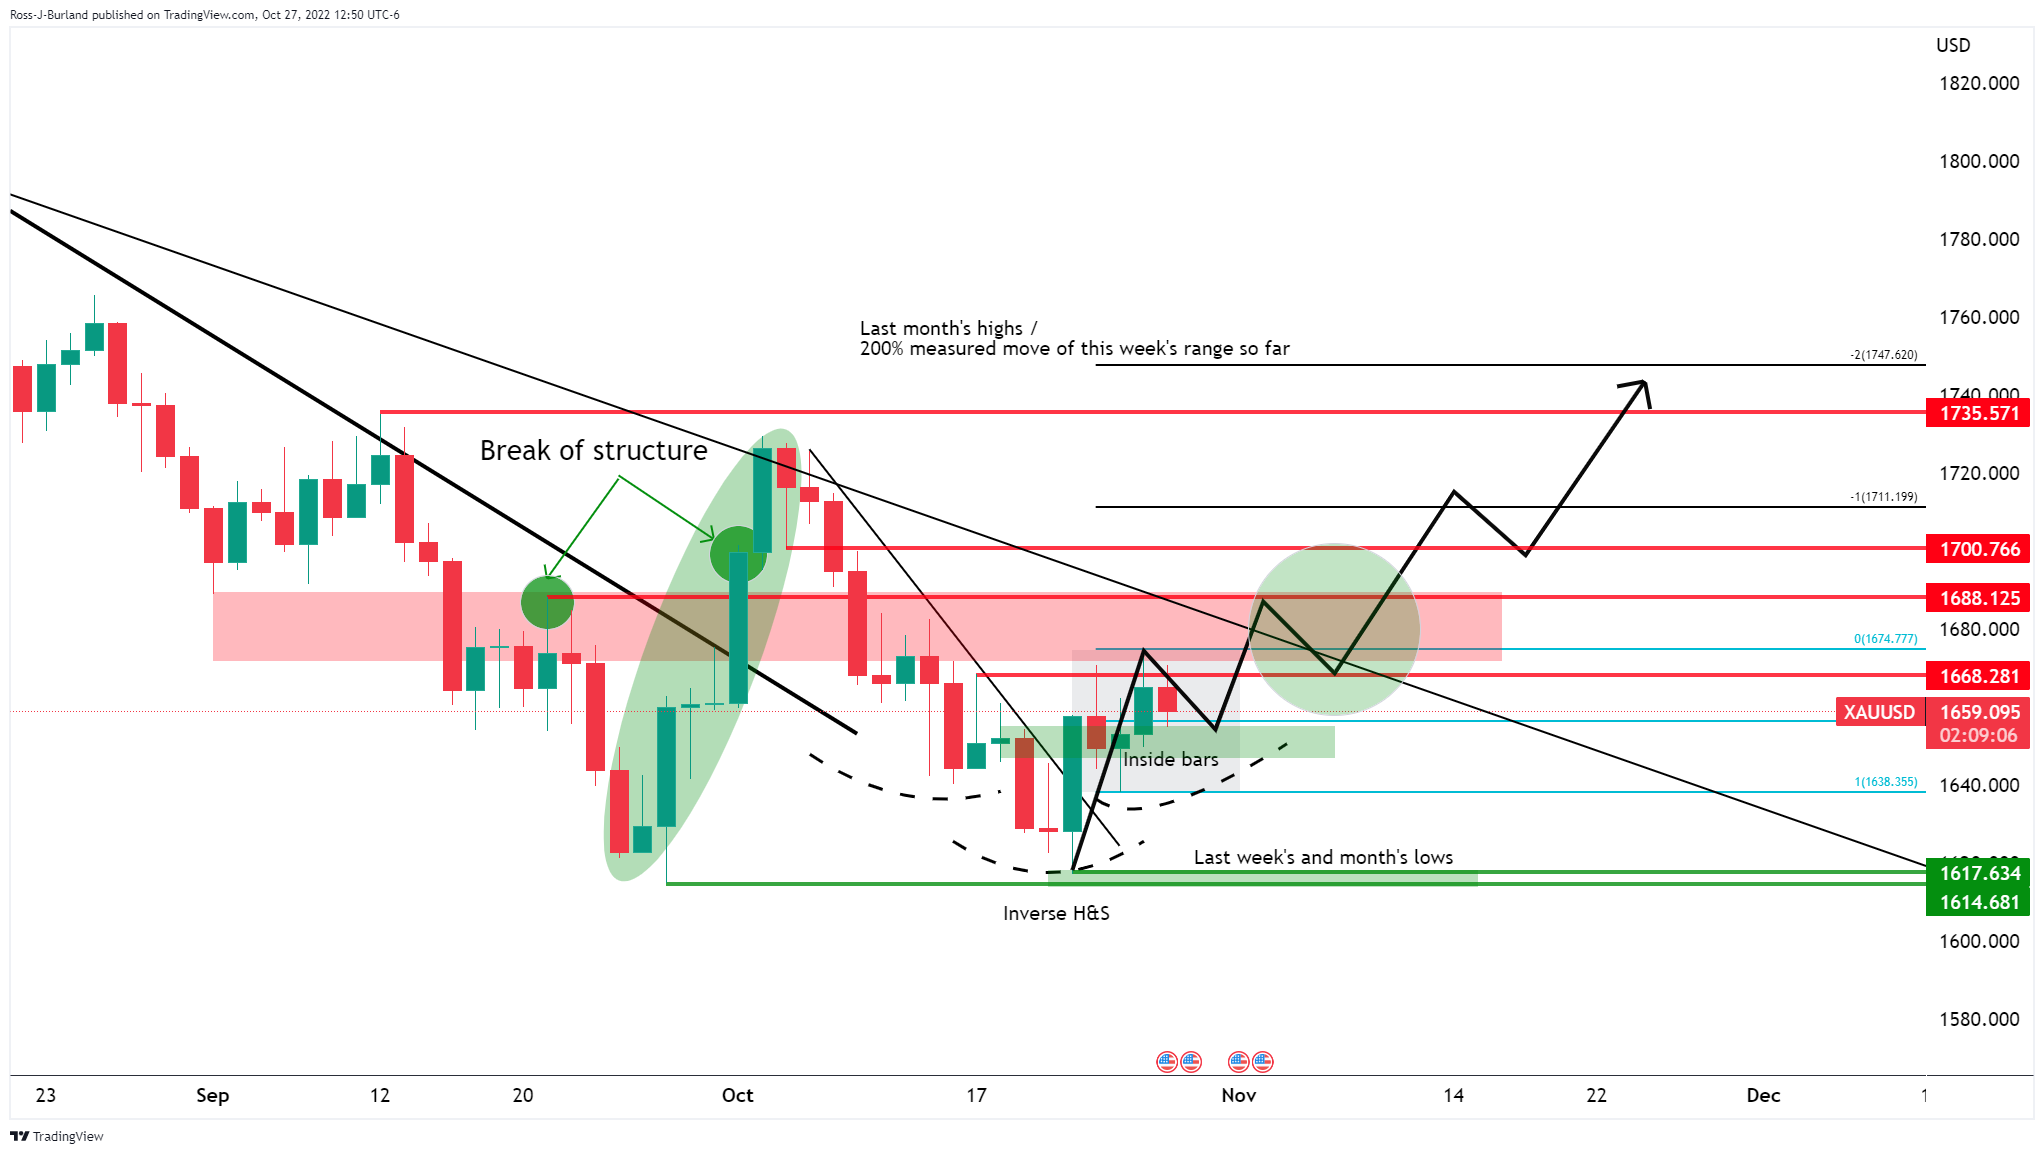
The price of gold has failed to get above a key resistance area on the daily chart of $1,668 where it needs to close on a daily basis to instil confidence in the upside prospects.
$1,675 the high was achieved on Wednesday as the US dollar continued to slide, but the close of $1,665 was less than convincing and has consequently led to a drop back inside of the range. Nevertheless, the daily chart, above, still shows a number of bullish confluences. We have seen the break of the daily structure back on Oct 3, This led to the yellow metal being forced onto the back side of the daily trendline resistance.
The price moved back into Wednesday 22 Sep bullish peak formation lows in a micro daily bear trend. We have also broken on the backside of the micro (secondary) daily trendline on Fri 22 Oct and we now have two prior inside days. This is a coiled market creating higher daily lows and the bulls could be about to make their move to break and close above $1,668 resistance in a breakout of the inverse head and shoulders neckline. Thereafter, a close above the $1,670 neckline could be the trigger point to start looking for the set-up on lower time frames.
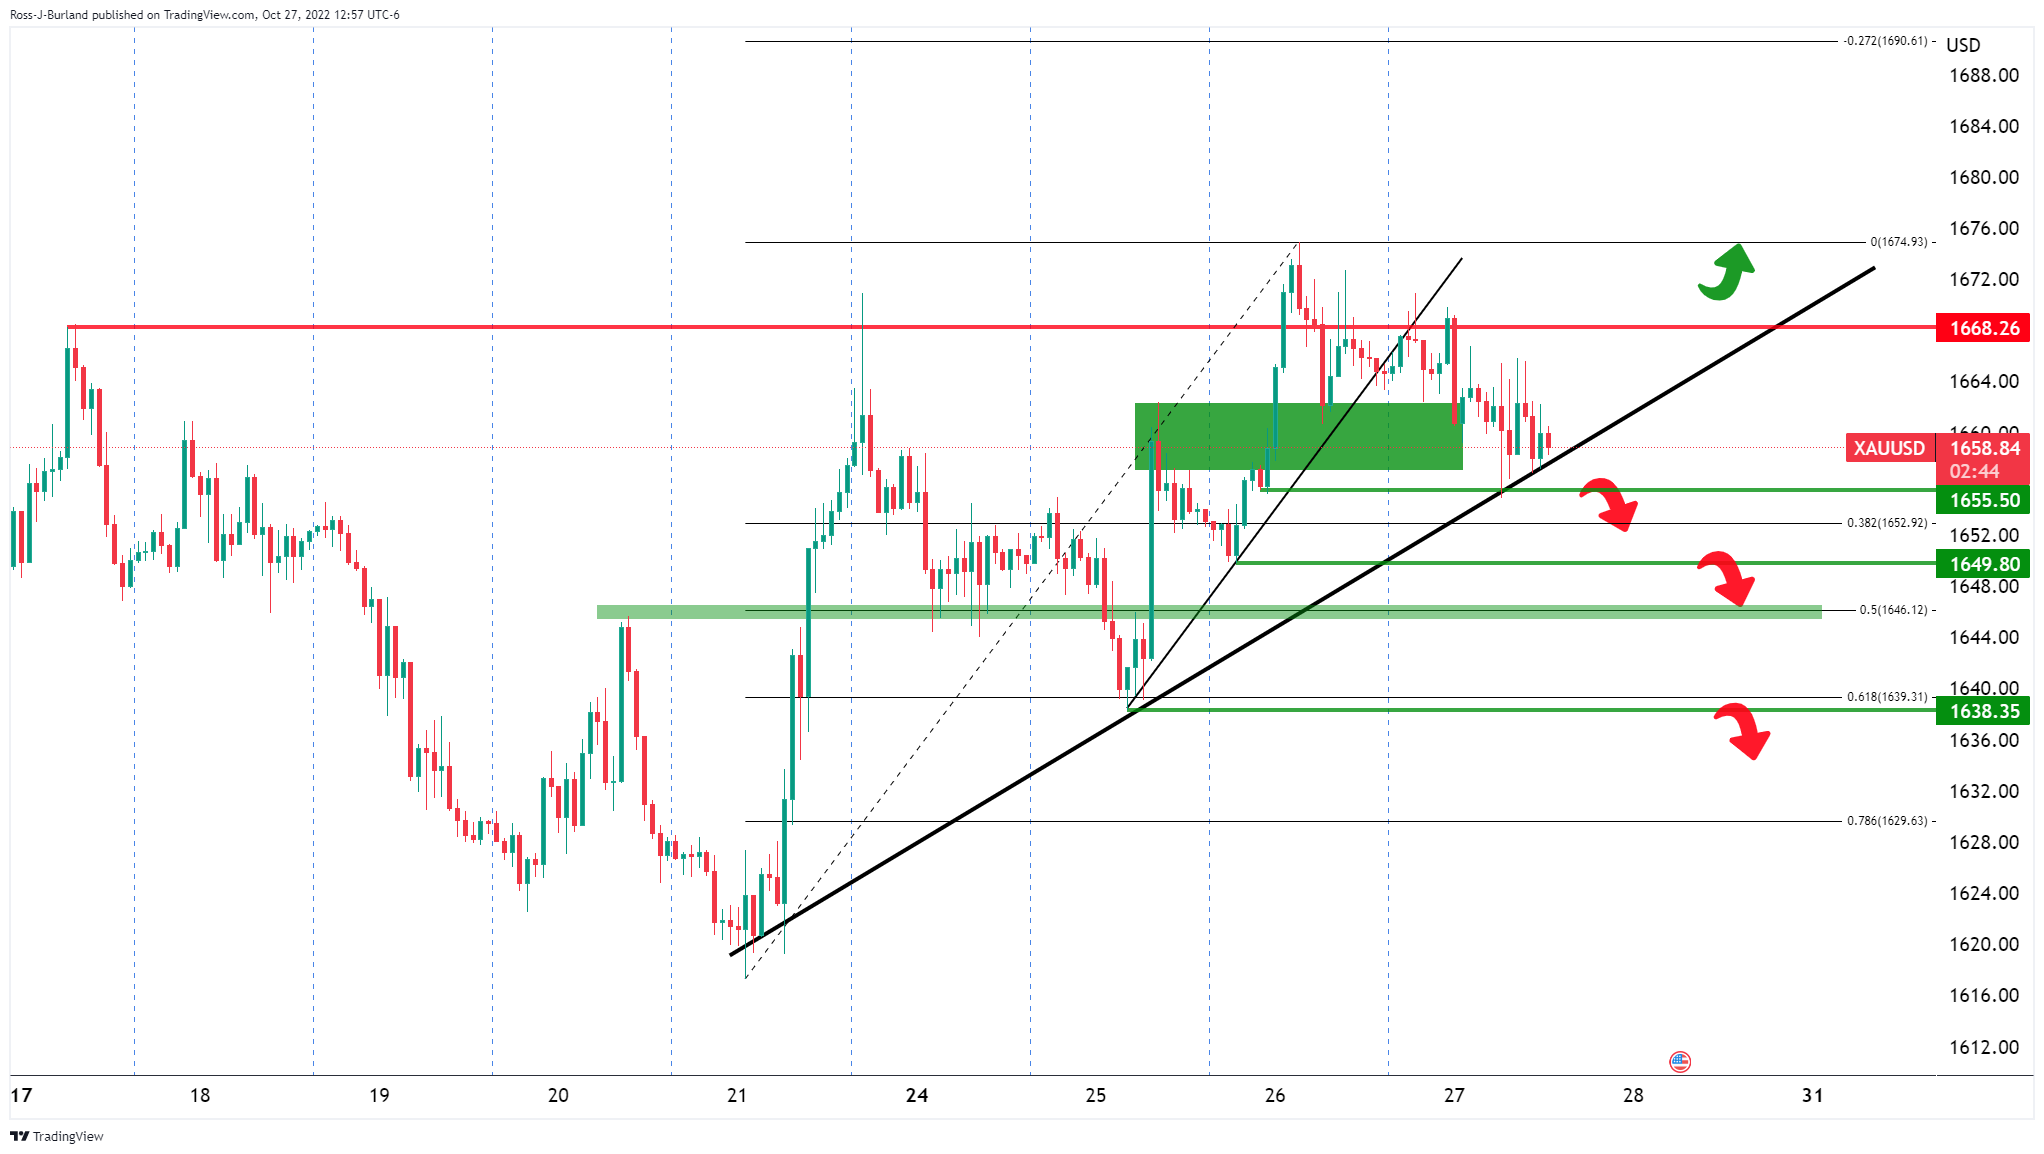
However, should the following playout on the hourly time frame, then the upside bias will be invalidated:

As shown, the price is pressed up against a key hourly trendline support. Should the bears send the price to the other side of it, on a break of $1,655, pressures could really start to build sending the price fatally below $1,650. A break of the 50% mean reversion of the current bullish trend will open the risk of a move to a 61.8% golden ratio near $1,640. If this fails to support, then there is nothing much in the way of a fast drop to the lows and beyond for a bearish continuation.
© 2000-2026. All rights reserved.
This site is managed by Teletrade D.J. LLC 2351 LLC 2022 (Euro House, Richmond Hill Road, Kingstown, VC0100, St. Vincent and the Grenadines).
The information on this website is for informational purposes only and does not constitute any investment advice.
The company does not serve or provide services to customers who are residents of the US, Canada, Iran, The Democratic People's Republic of Korea, Yemen and FATF blacklisted countries.
Making transactions on financial markets with marginal financial instruments opens up wide possibilities and allows investors who are willing to take risks to earn high profits, carrying a potentially high risk of losses at the same time. Therefore you should responsibly approach the issue of choosing the appropriate investment strategy, taking the available resources into account, before starting trading.
Use of the information: full or partial use of materials from this website must always be referenced to TeleTrade as the source of information. Use of the materials on the Internet must be accompanied by a hyperlink to teletrade.org. Automatic import of materials and information from this website is prohibited.
Please contact our PR department if you have any questions or need assistance at pr@teletrade.global.


