- Analytics
- News and Tools
- Market News
- Silver Price Forecast: XAG/USD oscillates around $18.60s despite high US T-bond yields
Silver Price Forecast: XAG/USD oscillates around $18.60s despite high US T-bond yields
- Silver price steadily advances, bouncing off daily lows around $18.55.
- The US 10-year Treasury bond yield rises above 4%, underpinning the buck.
- XAG/USD Price Forecast: Is neutral-downwards, a fall below $18.00 would exacerbate a test of the YTD low.
Silver price climbs as the North American session progresses, trimming earlier losses as US Treasury bond yields rise, as bets that the Federal Reserve would likely hike rates for the fourth time 75 bps increased, putting a lid on the precious metals segment. At the time of writing, XAG/USD is trading at $18.66, above its opening price by 0.33%.
XAG/USD falls as the US 10-year yield rises above 4%
The market sentiment remains upbeat, with most US equities remaining in the green. US Industrial Production exceeded estimates for the third consecutive month in September, increasing 0.4% MoM vs. estimates of 0.1%, while Capacity Utilization ticked up 2 points, from 80% to 80.3%.
Even though Tuesday’s data is encouraging, on Monday, the New York Fed Empire State Manufacturing Index disappointed market participants, contracting for the third straight month, as the survey showed that responders were downbeat about future business conditions.
A reflection of that is the greenback, which dropped more than 1% on Monday, as the US Dollar Index (DXY) portrays. Nevertheless, at the time of typing, the DXY is recovering some ground, gaining 0.12%, at 112.19, underpinned by the 10-year bond yield, which is yielding 4.027%, up one bps.
Hence, XAG/USD hovers around $18.64, pairing some of its earlier losses, while US T-bond yields, namely the 10-year, hold to the 4% threshold. Worth noting that the white metal recovery happened as Fed speakers have not crossed newswires. Silver traders should be aware that Atlanta’s Fed President Raphael Bostic and Minnesota Neil Kashkari would hit wires late in the day.
XAG/USD Price Forecast
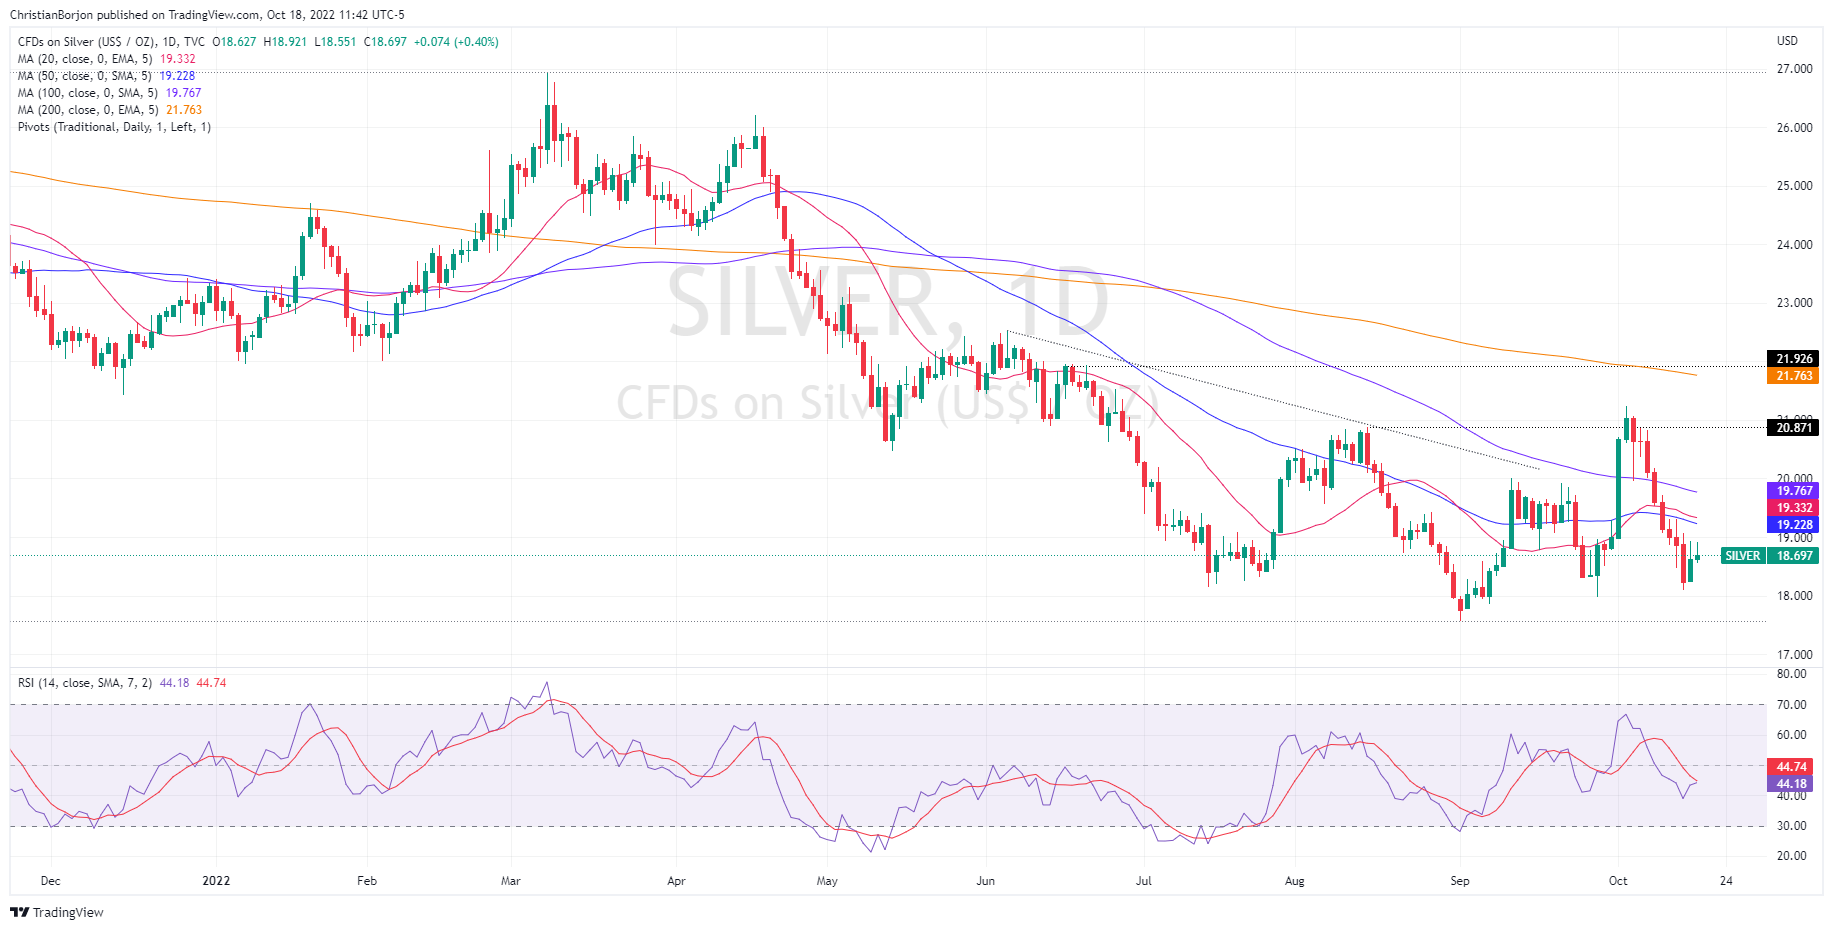
XAG/USD remains neutral-to-downward biased, as the daily moving averages (DMAs) reside above the spot price, but with the 20-DMA trapped between the 50 and 100-DMA. Of note, a cross of the 20-DMA below the 50-DMA would mean that sellers gather momentum, further confirmed by the Relative Strength Index (RSI) at bearish territory, which is almost flat. If the 20-DMA crosses below the 50-DMA, and the RSI crosses below its 7-SMA RSI, that could send XAG/USD tumbling towards $18.00, which, once cleared, could pave the way towards a YTD low of $17.56.

© 2000-2026. All rights reserved.
This site is managed by Teletrade D.J. LLC 2351 LLC 2022 (Euro House, Richmond Hill Road, Kingstown, VC0100, St. Vincent and the Grenadines).
The information on this website is for informational purposes only and does not constitute any investment advice.
The company does not serve or provide services to customers who are residents of the US, Canada, Iran, The Democratic People's Republic of Korea, Yemen and FATF blacklisted countries.
Making transactions on financial markets with marginal financial instruments opens up wide possibilities and allows investors who are willing to take risks to earn high profits, carrying a potentially high risk of losses at the same time. Therefore you should responsibly approach the issue of choosing the appropriate investment strategy, taking the available resources into account, before starting trading.
Use of the information: full or partial use of materials from this website must always be referenced to TeleTrade as the source of information. Use of the materials on the Internet must be accompanied by a hyperlink to teletrade.org. Automatic import of materials and information from this website is prohibited.
Please contact our PR department if you have any questions or need assistance at pr@teletrade.global.


