- Analytics
- News and Tools
- Market News
- AUD/USD Price Analysis: Bears push to the edge of the abyss, looking over it to
AUD/USD Price Analysis: Bears push to the edge of the abyss, looking over it to
- AUD/USD bulls eye the channel top near 0.6450 on a break of the 38.2% Fibonacci and 50% mean reversion area near 0.6380/0.6400.
- AUD/USD bears are moving the price towards the edge of the abyss and 0.6350.
AUD/USD has opened at support but hangs over the edge of the abyss at 0.6350 which guards the risk of a fall to 0.6150 for the week (s) ahead. The US dollar is on the march, supported by strong yields and the Federal Reserve's campaign to hike rates following Friday's strong US Nonfarm Payrolls data.
Speculators' net long positioning on the US dollar fell in the latest week to the lowest since mid-March, according to calculations by Reuters and U.S. Commodity Futures Trading Commission data released on Friday. This leaves scope for a reaccumulation of those positions that could add pressure to AUS/USD. The value of the net long dollar position slid to $9.44 billion in the week ended Oct. 4, from $10.43 billion the previous week, CFTC data showed.
The following illustrates both the bullish and bearish scenarios for days ahead with a strong bias to the downside longer term:
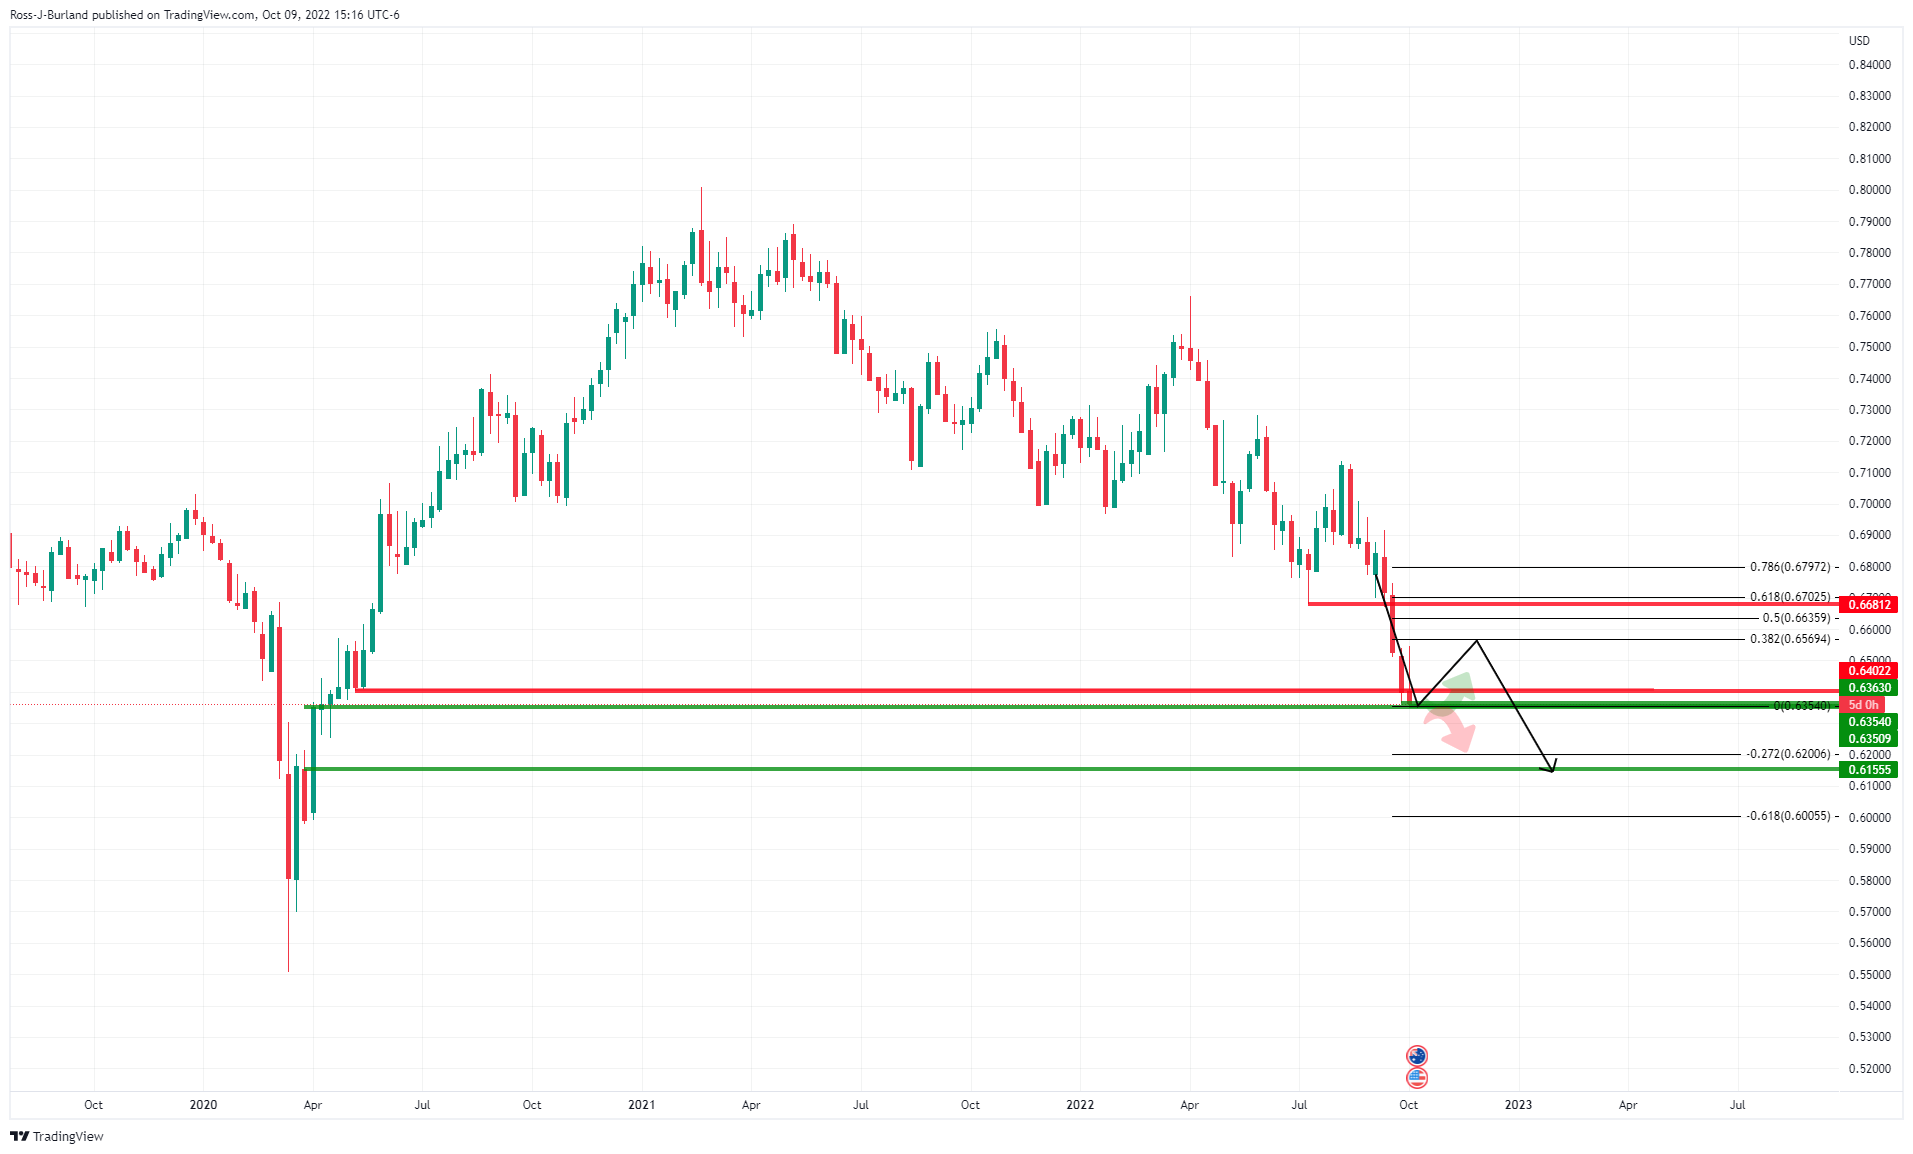
AUD/USD weekly charts

While there are prospects of a retracement of the weekly downtrend, the broader trend is lower. The Fibonacci scale can be drawn to look for confluences with structure. In this regard, the 61.8% aligns with the July lows near 0.6700. However, should the dollar remain strong, that will be a tall order to achieve.
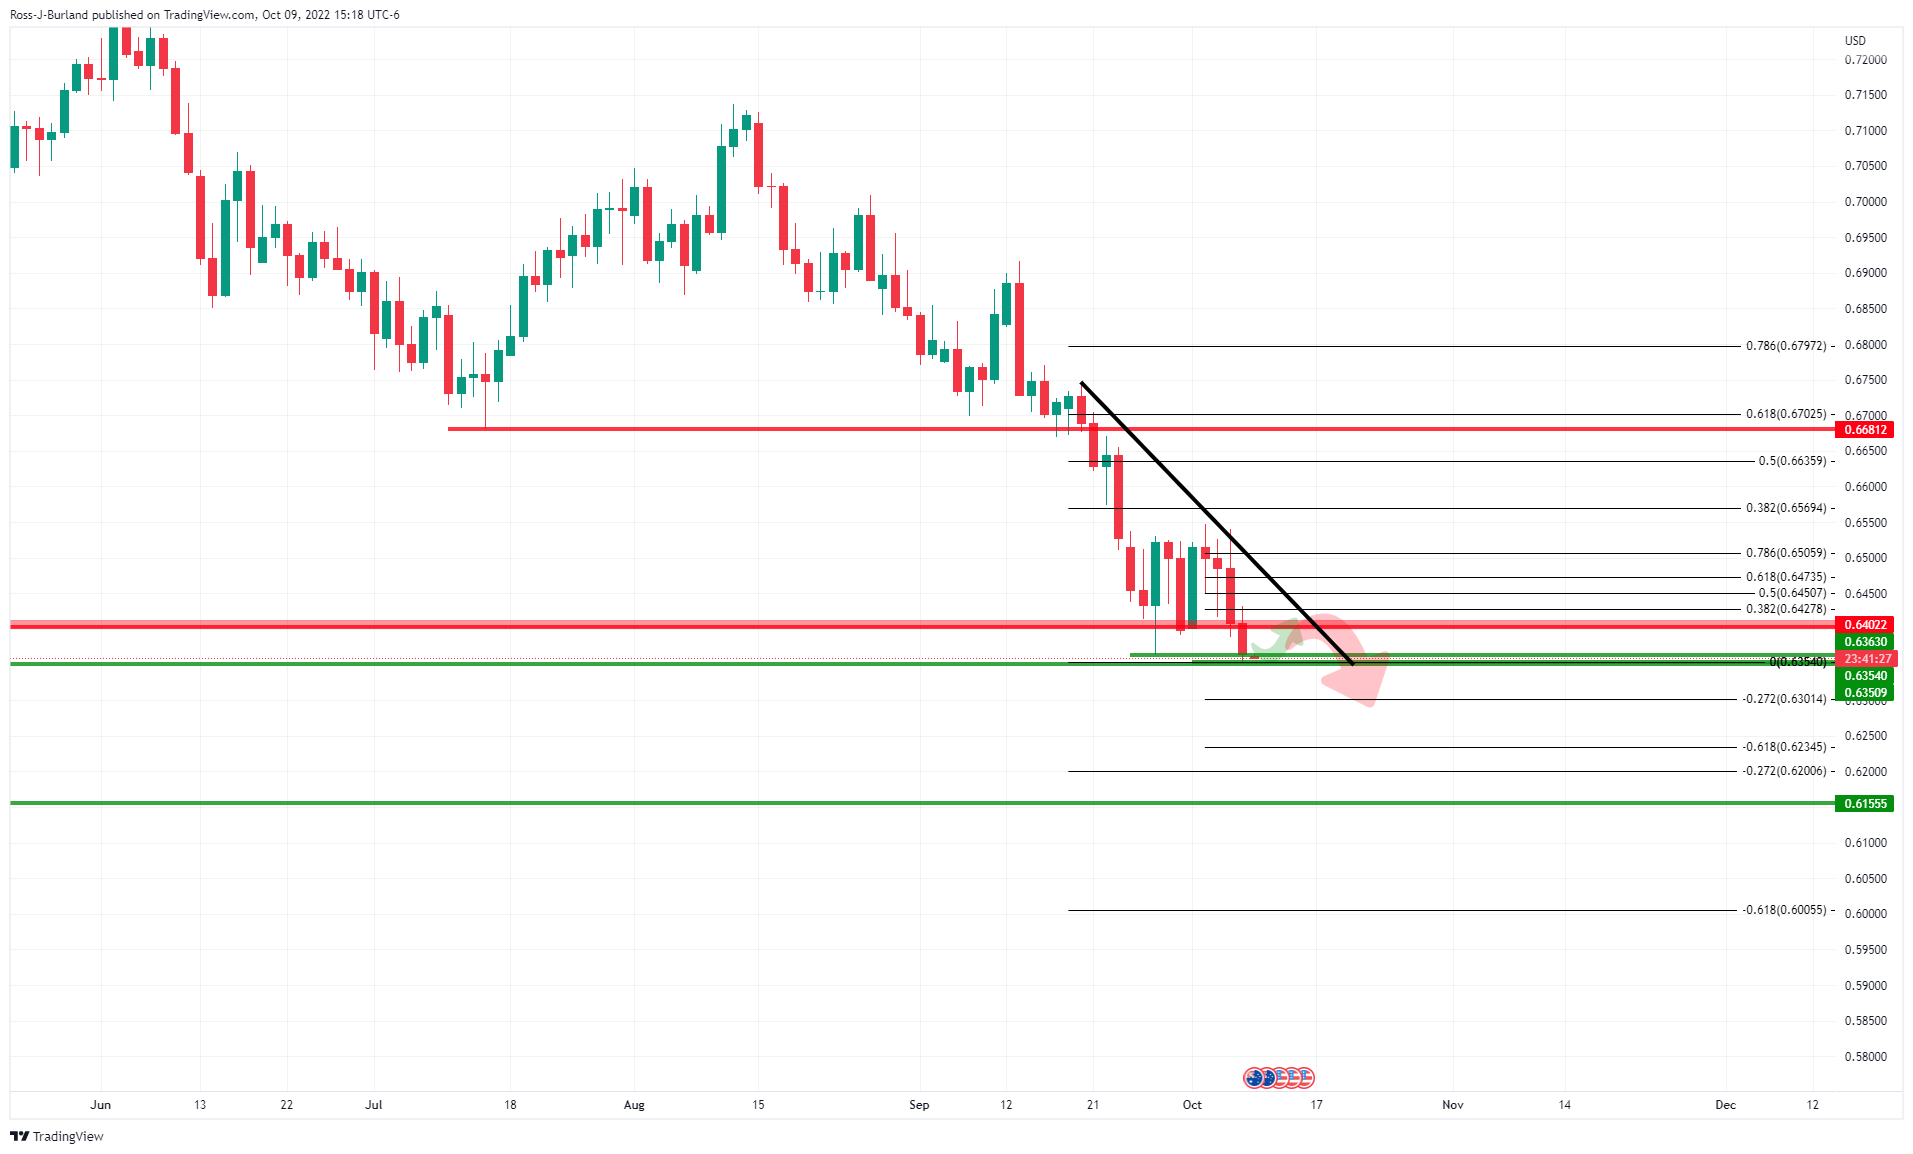
AUD/USD daily chart

Moreover, the bulls will first need to overcome the daily resistance near 0.6550.
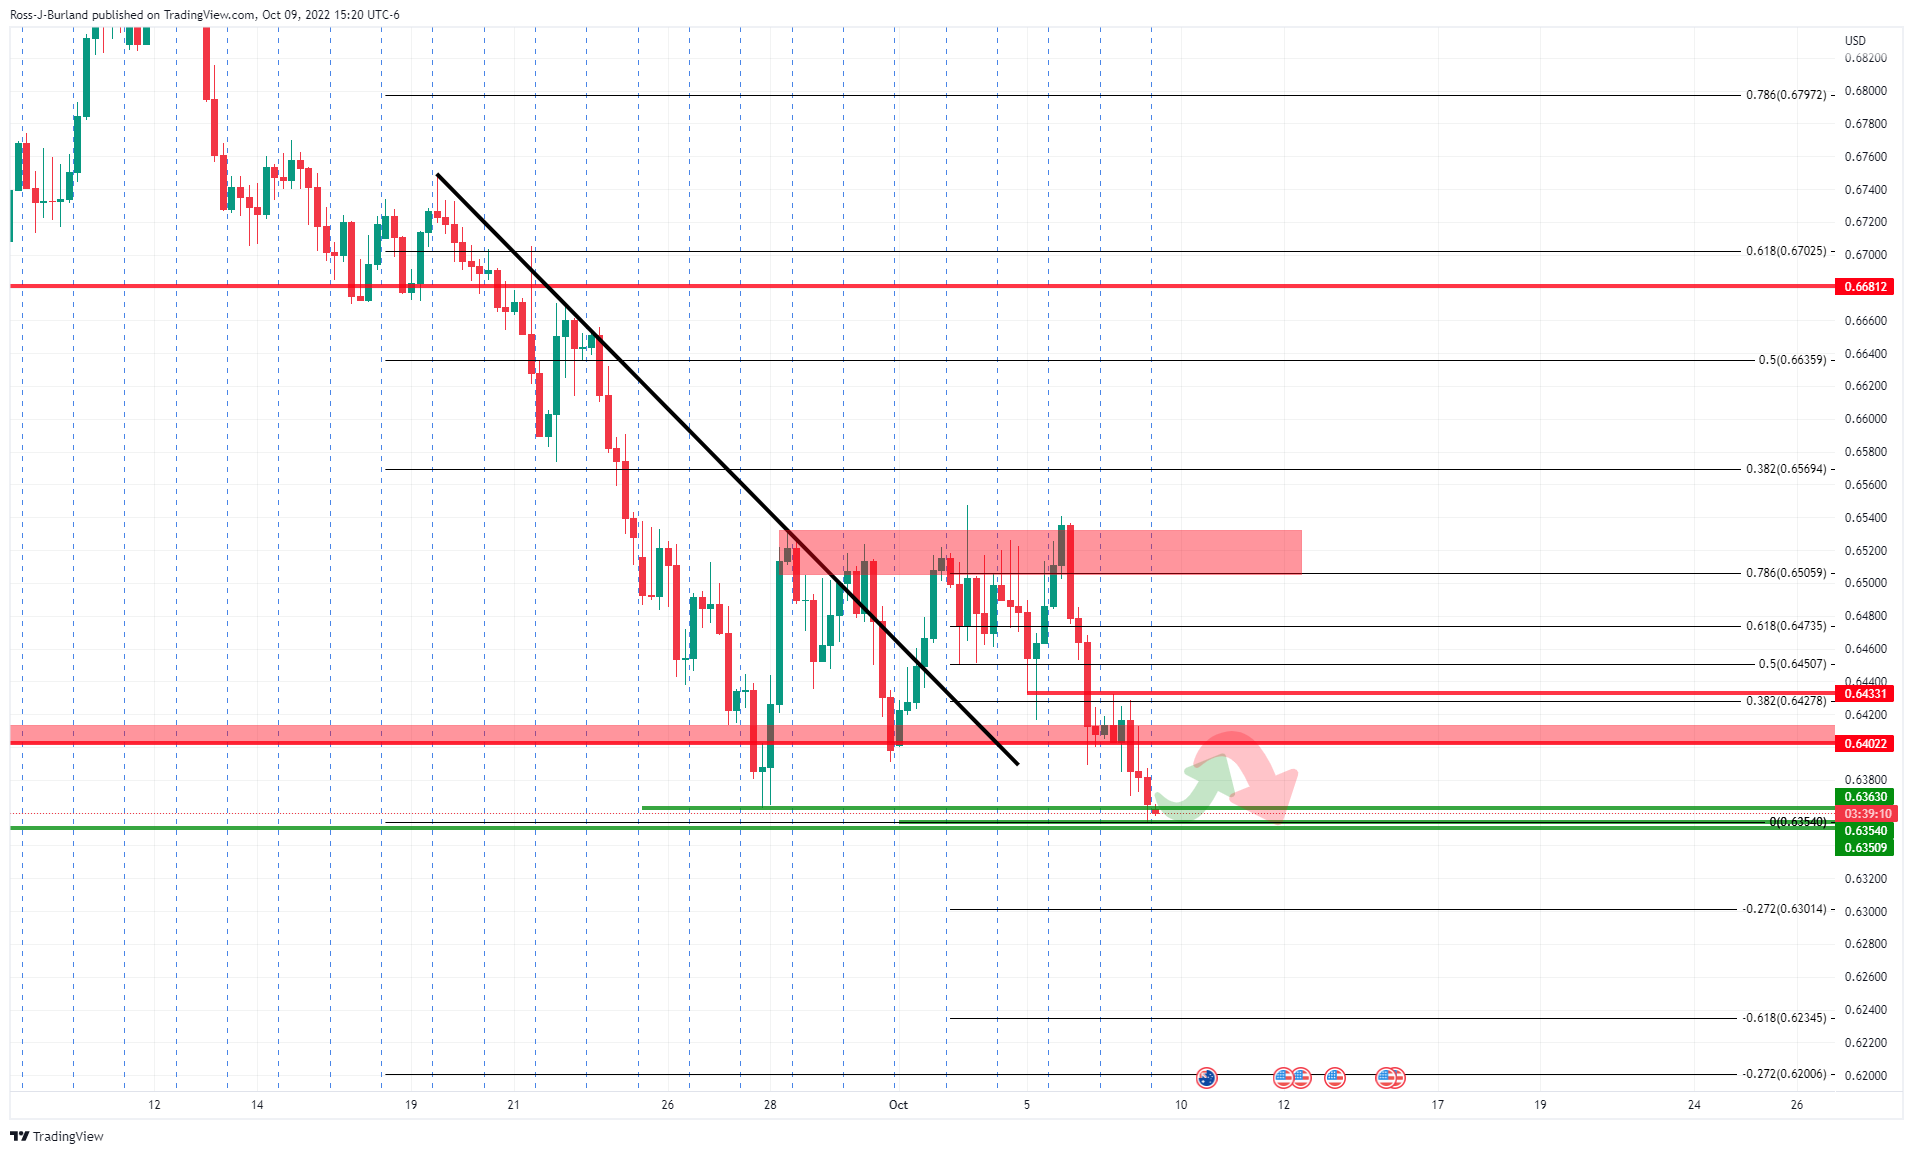
AUD/USD H4 chart

On the 4-hour time frame, the price has slid beyond the trendline resistance but is failing to hold convincingly within the channel. Nevertheless, bulls could be attracted at this stage for a discount so long as the support structure holds and the price can form a build-up of bullish candles for traders to lean into.
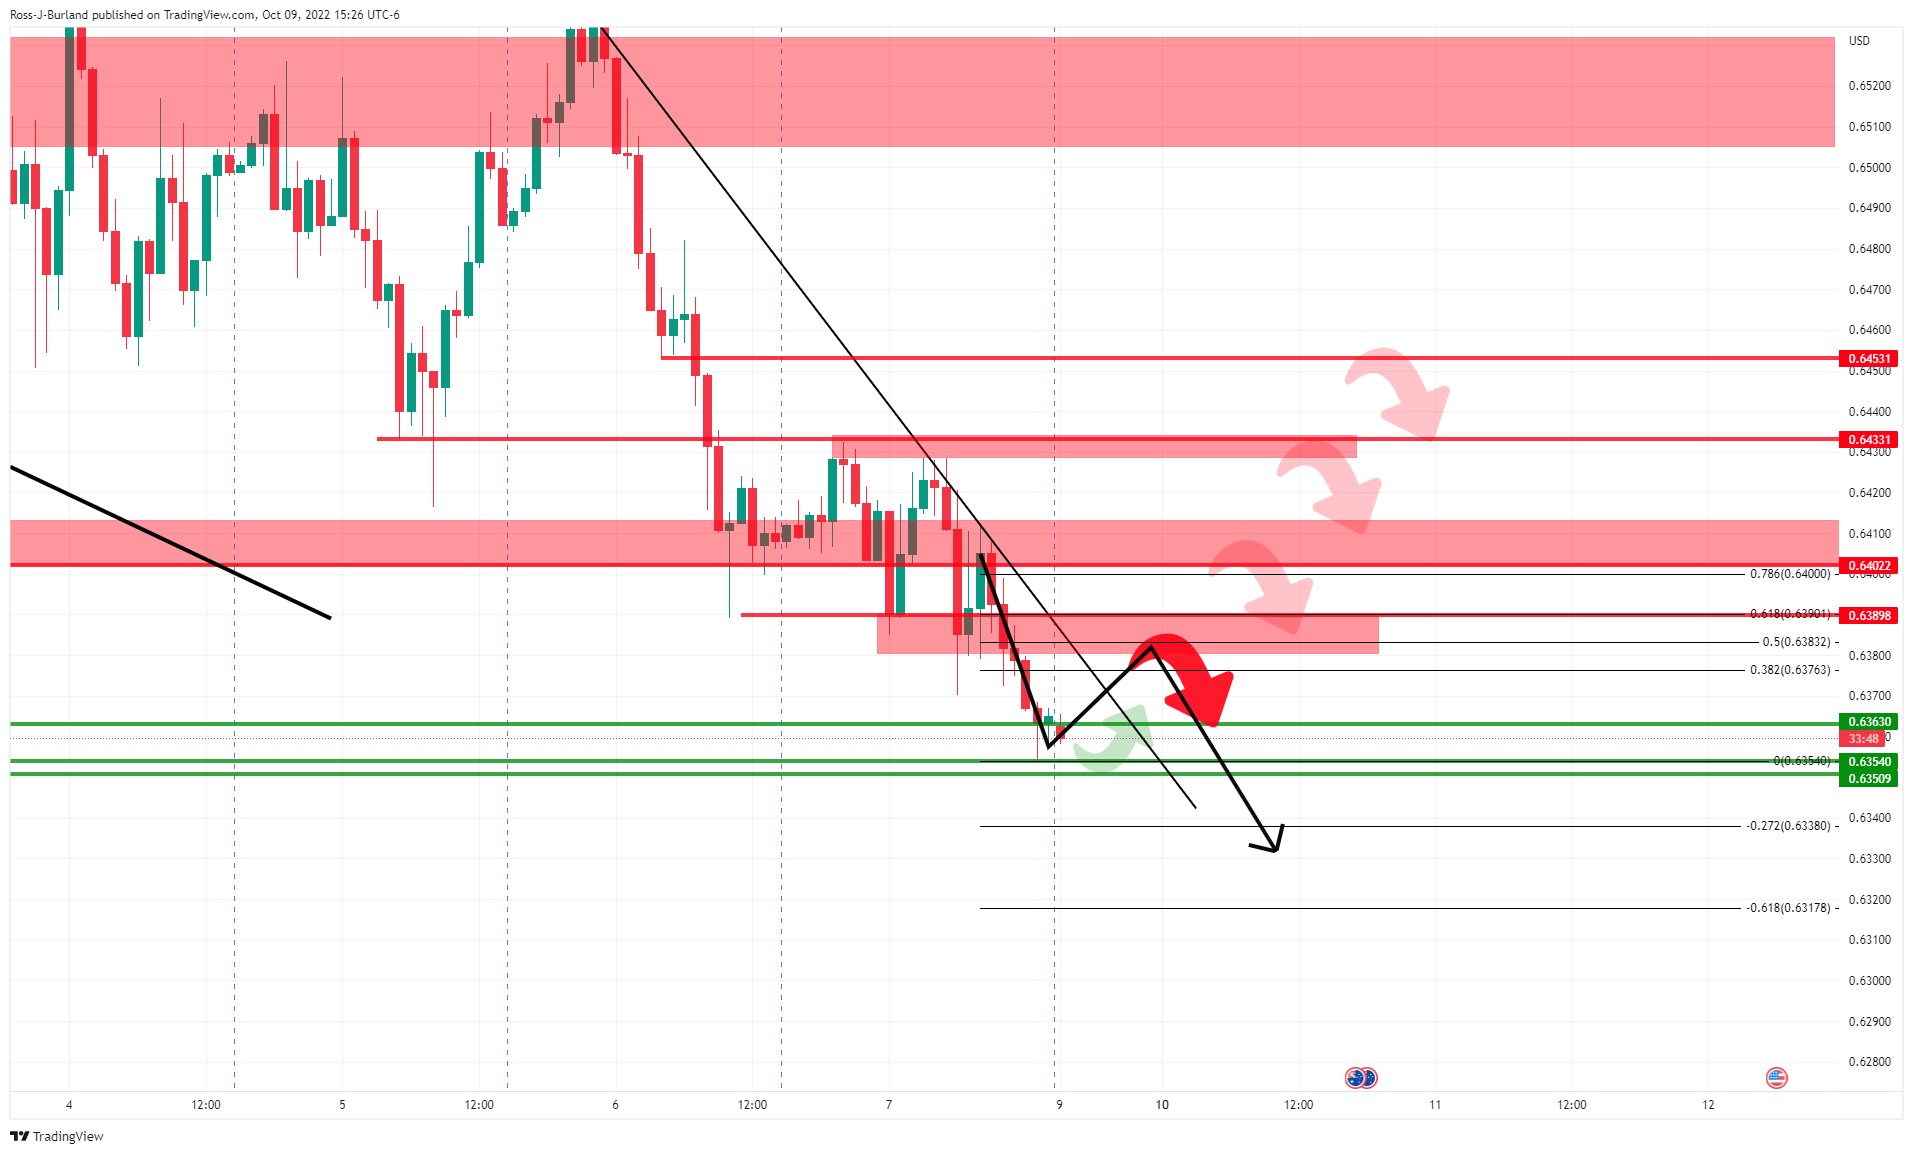
AUD/USD H1 chart

If the bulls do overcome the bears, there will be potentially strong resistance on the way up, as signified by the bearish arrows at key structural points along the way to the midpoint of the channel near 0.6450. This first hurdle comes at the confluence of the 38.2% Fibonacci and 50% mean reversion area near 0.6380/0.6400. A break there could be the most significant as it will open the way to higher levels.
© 2000-2026. All rights reserved.
This site is managed by Teletrade D.J. LLC 2351 LLC 2022 (Euro House, Richmond Hill Road, Kingstown, VC0100, St. Vincent and the Grenadines).
The information on this website is for informational purposes only and does not constitute any investment advice.
The company does not serve or provide services to customers who are residents of the US, Canada, Iran, The Democratic People's Republic of Korea, Yemen and FATF blacklisted countries.
Making transactions on financial markets with marginal financial instruments opens up wide possibilities and allows investors who are willing to take risks to earn high profits, carrying a potentially high risk of losses at the same time. Therefore you should responsibly approach the issue of choosing the appropriate investment strategy, taking the available resources into account, before starting trading.
Use of the information: full or partial use of materials from this website must always be referenced to TeleTrade as the source of information. Use of the materials on the Internet must be accompanied by a hyperlink to teletrade.org. Automatic import of materials and information from this website is prohibited.
Please contact our PR department if you have any questions or need assistance at pr@teletrade.global.


