- Analytics
- News and Tools
- Market News
- Gold Price Forecast: XAU/USD advances towards $1,730 despite a rebound in DXY, US NFP buzz
Gold Price Forecast: XAU/USD advances towards $1,730 despite a rebound in DXY, US NFP buzz
- Gold price is marching towards the critical hurdle of $1,730.00 ahead of US NFP data.
- A marginal decline in odds for a 75 bps rate hike has supported the gold bulls.
- The Fed's long spell of rate hikes is responsible for lower US NFP projections.
Gold price (XAU/USD) has extended its gains above the immediate hurdle of $1,720.00 and is aiming to test a three-week high at around $1,730.00. The precious metal is scaling higher gradually as the US dollar index (DXY) has displayed a subdued performance. A rebound has been witnessed in the DXY after refreshing the day’s low around 110.80 but the soaring market mood will keep a lid over the DXY bulls.
The 10-year benchmark US Treasury yields have fallen below 3.75% amid a minor decline in bets for a 75 basis point (bps) interest rate hike by the Federal Reserve (Fed). Per the CME Fedwatch tool, the probability of 67.8% for a three-quarter-to-a-percent rate hike, recorded in early Tokyo, has slipped to 64.7% in the early European session.
Wednesday’s upbeat US ISM Non-Manufacturing PMI data and US Automatic Data Processing (ADP) Employment figures brought a significant rally in the DXY but have turned subdued ahead of US Nonfarm Payrolls (NFP) data. The payroll data is expected to decline to 250k vs. the former release of 315k. The spell of rate hikes by the Fed has forced the corporate to postpone their capacity expansion plans, resulting in weaker consensus for the labor additions data.
Gold technical analysis
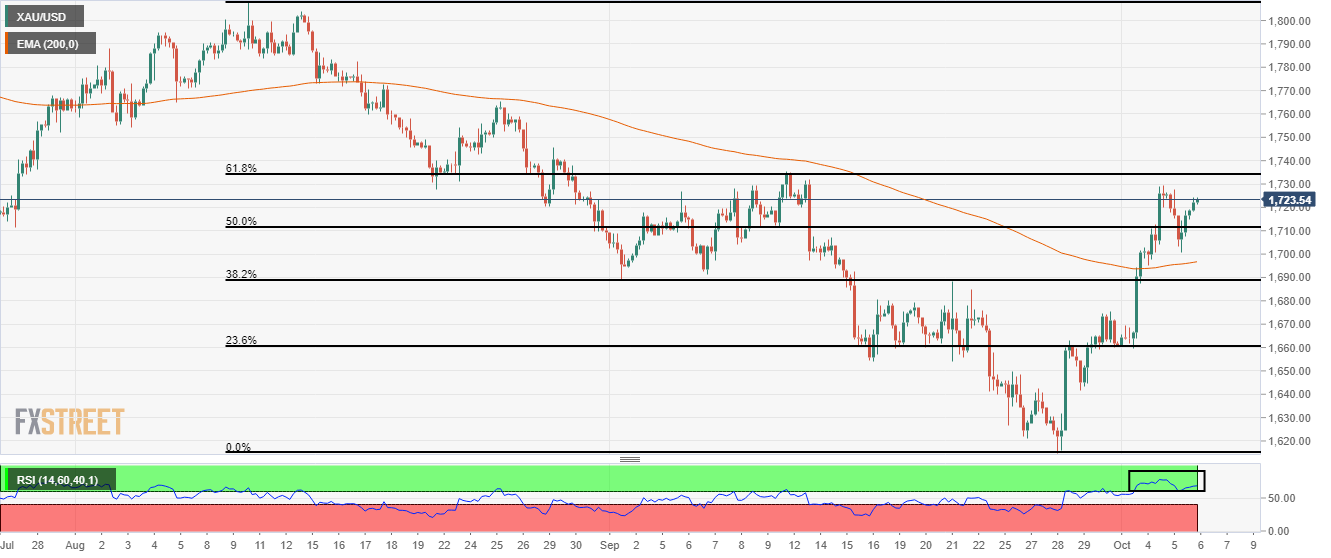
On an hourly scale, gold prices are marching towards the 61.8% Fibonacci retracement (from August 10 high at $1,807.93 to September low at $1,614.85) at $1,734.58. The 200-period Exponential Moving Average (EMA) at $1,697.00 has tilted towards the north, which indicates more upside ahead.
Meanwhile, the Relative Strength Index (RSI) (14) has picked demand at 60.00, which indicates that the market participants have capitalized on the pullback move for creating longs.
Gold four-hour chart

© 2000-2026. All rights reserved.
This site is managed by Teletrade D.J. LLC 2351 LLC 2022 (Euro House, Richmond Hill Road, Kingstown, VC0100, St. Vincent and the Grenadines).
The information on this website is for informational purposes only and does not constitute any investment advice.
The company does not serve or provide services to customers who are residents of the US, Canada, Iran, The Democratic People's Republic of Korea, Yemen and FATF blacklisted countries.
Making transactions on financial markets with marginal financial instruments opens up wide possibilities and allows investors who are willing to take risks to earn high profits, carrying a potentially high risk of losses at the same time. Therefore you should responsibly approach the issue of choosing the appropriate investment strategy, taking the available resources into account, before starting trading.
Use of the information: full or partial use of materials from this website must always be referenced to TeleTrade as the source of information. Use of the materials on the Internet must be accompanied by a hyperlink to teletrade.org. Automatic import of materials and information from this website is prohibited.
Please contact our PR department if you have any questions or need assistance at pr@teletrade.global.


