- Analytics
- News and Tools
- Market News
- Gold Price Forecast: XAU/USD resumes upside journey after a correction to near $1,750, Fed’s Powell eyed
Gold Price Forecast: XAU/USD resumes upside journey after a correction to near $1,750, Fed’s Powell eyed
- Gold price is eyeing a break above $1,760.00 for more upside.
- The Fed has the luxury to scale down its hawkish tone on policy guidance.
- The US Core PCE data is expected to trim by 10 bps to 4.7% on an annual basis.
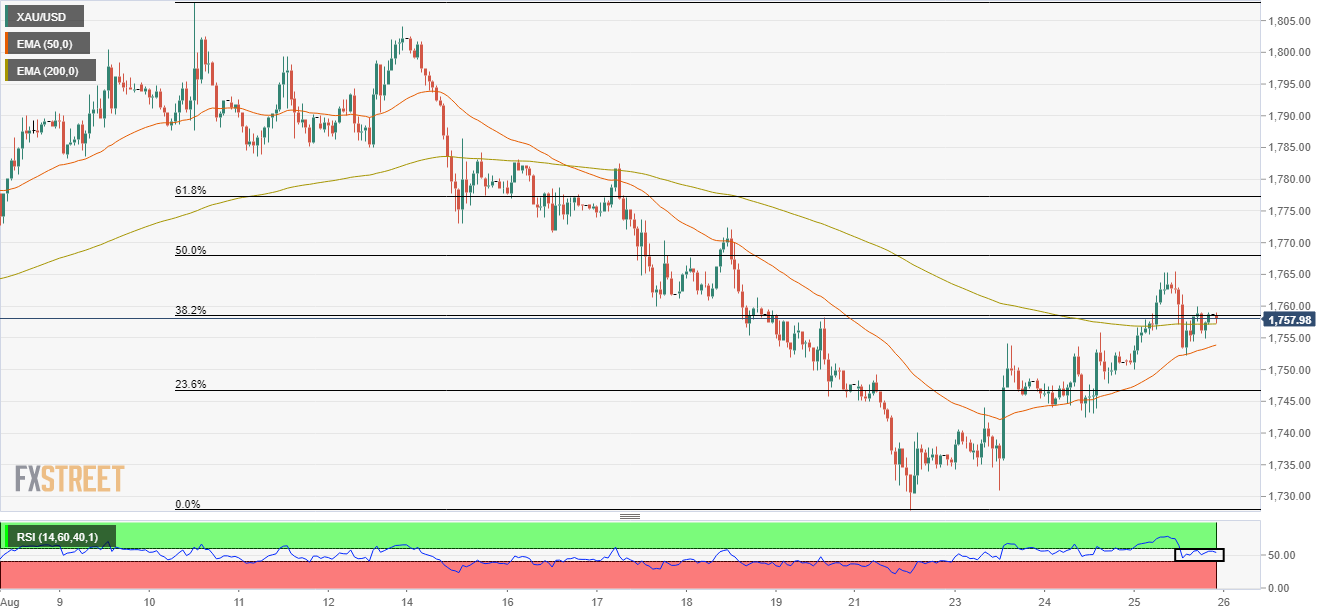
Gold price (XAU/USD) is advancing gradually higher after correcting to $1,752.30 on Thursday. The precious metal witnessed a vertical fall as the FX domain turned volatile ahead of Jackson Hole Economic Symposium. The yellow metal has rebounded and has advanced to near $1,758.00, however, more gains will be recorded if the asset oversteps the immediate hurdle of $1,760.00.
The gold prices are likely to dance to the tunes of commentary from Fed chair Jerome Powell at Jackson Hole on Friday. After a steep contraction in the US economic activities and a slump in overall demand indicated by weak US Durable Goods Orders, the street believes that the Fed should scale down the pace of hiking interest rates.
Fed policymakers have evidence of exhaustion in the price pressures and also the global supply chain risks have trimmed sharply. Therefore, the Fed has the luxury to scale down its hawkish tone slightly till the time the US economic activities could get to a restoration level.
Apart from that, investors will focus on the US Core Personal Consumption Expenditure (PCE) data, which is expected to decline to 4.7% from the prior print of 4.8%. This may weaken the US dollar index (DXY) further.
Gold technical analysis
On an hourly scale, gold prices are struggling to surpass 38.2% Fibonacci retracement (placed from the August 10 high at $1,807.93 to Monday’s low at $1,727.87) at $1,758.40. The gold prices are entirely focusing on sustaining above the 200-period Exponential Moving Average (EMA) at $1,757.18, which will bolster the odds of a bullish reversal.
Also, the 50-period EMA at $1,754.00 has remained a major supportive tool for the asset.
Meanwhile, the Relative Strength Index (RSI) (14) has shifted into the 40.00-60.00 range, which indicates that bulls are not strengthened enough for a while. However, a break above 60.00 will kick-start a fresh bullish impulsive wave.
Gold hourly chart

© 2000-2026. All rights reserved.
This site is managed by Teletrade D.J. LLC 2351 LLC 2022 (Euro House, Richmond Hill Road, Kingstown, VC0100, St. Vincent and the Grenadines).
The information on this website is for informational purposes only and does not constitute any investment advice.
The company does not serve or provide services to customers who are residents of the US, Canada, Iran, The Democratic People's Republic of Korea, Yemen and FATF blacklisted countries.
Making transactions on financial markets with marginal financial instruments opens up wide possibilities and allows investors who are willing to take risks to earn high profits, carrying a potentially high risk of losses at the same time. Therefore you should responsibly approach the issue of choosing the appropriate investment strategy, taking the available resources into account, before starting trading.
Use of the information: full or partial use of materials from this website must always be referenced to TeleTrade as the source of information. Use of the materials on the Internet must be accompanied by a hyperlink to teletrade.org. Automatic import of materials and information from this website is prohibited.
Please contact our PR department if you have any questions or need assistance at pr@teletrade.global.


