- Analytics
- News and Tools
- Market News
- Gold Price Forecast: XAU/USD refreshes day’s low near $1,740, Jackson Hole hogs limelight
Gold Price Forecast: XAU/USD refreshes day’s low near $1,740, Jackson Hole hogs limelight
- Gold price has given a downside break of $1,745.02-1,749.15 territory and has refreshed day’s low at $1,744.00.
- The odds of a 50 bps rate hike by the Fed are accelerating vigorously.
- A decline in US Durable Goods Orders in times of soaring inflation will impact the DXY prices.
Gold price (XAU/USD) displayed an inventory distribution profile, oscillating in a narrow range of $1,745.02-1,749.15 but has given a downside break and has refreshed its day’s low at $1,744.00 in the Asian session. The precious metal has continued its five-day losing streak after surrendering Friday’s low of $1,745.59. The yellow metal is likely to remain on the tenterhooks as investors are awaiting Federal Reserve (Fed)’s commentary on policy guidance.
Considering the Fed minutes, the hawkish tone may trim as price pressures are reaching their peak levels and the consequences of shrinking liquidity from the US economy could display its true colors later. To maintain balance, a rate hike by 50 basis points (bps) looks optimal. Also, “Most economists in an Aug. 16-19 Reuters poll have predicted a half percentage point hike next month, the same as in the last poll, which would take the key interest rate to 2.75%-3.00%.”
This week, the cues from US Durable Goods Orders will also provide insights into the overall demand. As per the market consensus, the economic data is likely to decline to 0.6% from the prior release of 2%. In times, when the US economy has already displayed an unchanged US core Consumer Price Index (CPI), a decline in the economic data is not lucrative for the US dollar index (DXY).
Gold technical analysis
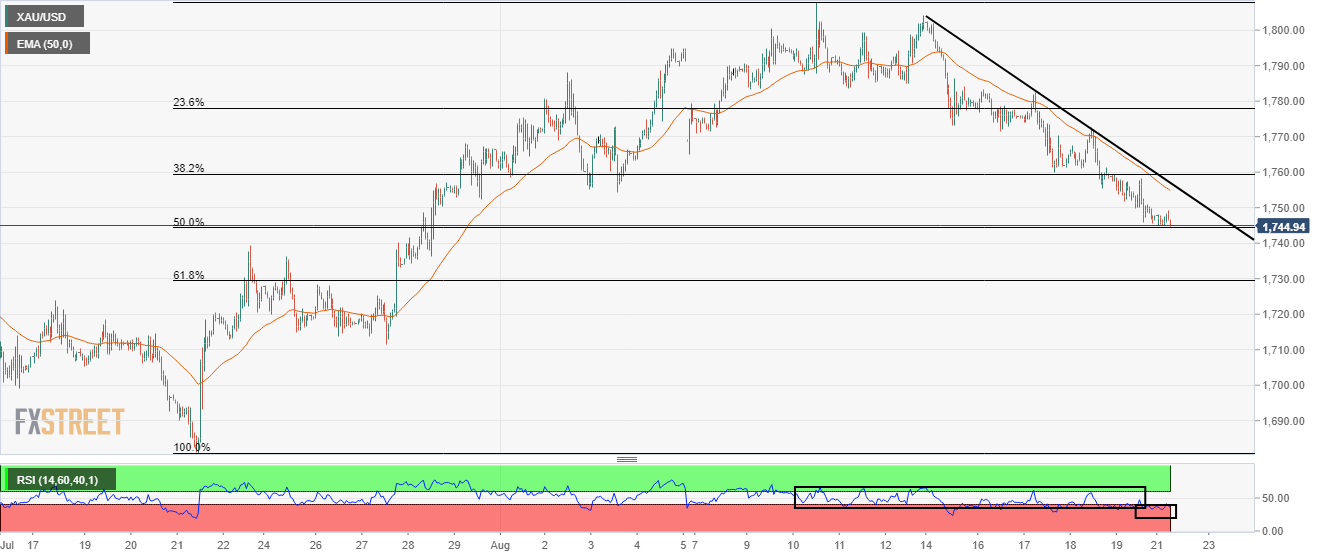
Gold prices have declined to near 50% Fibonacci retracement (placed from July 21 low at $1,680.91 to August 10 high at $1,807.93) at $1,744.70 on an hourly scale. The downward sloping trendline placed from August 12 high at $1,804.00 will act as major resistance for the counter.
The 50-period Exponential Moving Average (EMA) at $1,755.00 is declining firmly, which adds to the downside filters. Meanwhile, the Relative Strength Index (RSI) (14) is oscillating in a bearish range of 20.00-40.00, which favors more downside ahead.
Gold hourly chart

© 2000-2026. All rights reserved.
This site is managed by Teletrade D.J. LLC 2351 LLC 2022 (Euro House, Richmond Hill Road, Kingstown, VC0100, St. Vincent and the Grenadines).
The information on this website is for informational purposes only and does not constitute any investment advice.
The company does not serve or provide services to customers who are residents of the US, Canada, Iran, The Democratic People's Republic of Korea, Yemen and FATF blacklisted countries.
Making transactions on financial markets with marginal financial instruments opens up wide possibilities and allows investors who are willing to take risks to earn high profits, carrying a potentially high risk of losses at the same time. Therefore you should responsibly approach the issue of choosing the appropriate investment strategy, taking the available resources into account, before starting trading.
Use of the information: full or partial use of materials from this website must always be referenced to TeleTrade as the source of information. Use of the materials on the Internet must be accompanied by a hyperlink to teletrade.org. Automatic import of materials and information from this website is prohibited.
Please contact our PR department if you have any questions or need assistance at pr@teletrade.global.


