- Analytics
- News and Tools
- Market News
- EUR/USD seesawing around 1.0210 as traders brace for US CPI data
EUR/USD seesawing around 1.0210 as traders brace for US CPI data
- Despite a dismal market mood, EUR/USD edges higher in a choppy trading session.
- US, Germany, and Italy’s inflation data are eyed on Wednesday.
- EUR/USD Price Analysis: Range-bound, but US economic data might rock the boat.
The shared currency advances during the New York session, taking advantage of a soft US dollar, which is falling despite US bond yields rising, ahead of the release of July’s US inflation figures. Alongside the aforementioned, risk-aversion keeps safe-haven peers in the driver’s seat, except for the greenbacks vs. the euro.
EUR/USD unable to capitalize on overall greenback weakness
The EUR/USD is trading at 1.0216, above its opening price but below its daily high, reached during the day at 1.0247. Nevertheless, buyers could not hold the fort or booked profits with US economic data looming.
US equities are trading with minimal losses. A light US calendar keeps investors reassessing last week’s US jobs report, with the US Nonfarm payrolls doubling expectations, increasing by 528K. Nevertheless, traders’ focus has shifted towards the Consumer Price Index (CPI). Estimations of headline inflation lie at 8.7% YoY, less than June’s 9%, while core-CPI, which excludes food and energy, is expected to rise by 6.1% YoY, vs. 6.2% in last month’s reading.
Across the pond, headlines that Russia’s halted oil pumping through the Druzbha pipeline since Thursday added to an already negative mood, weighing on the EUR/USD. The Russian oil company Transneft blamed problems with payment to UkrTransNafta, the operator of the Ukrainian side.
What to watch
The EU economic calendar will feature inflation figures for Germany and Italy. On the US docket, the US Consumer Price Index (CPI), core CPI, and Fed commentary after inflation data’s release will give further forward guidance of the Fed’s tightening path.
EUR/USD Price Analysis: Technical outlook
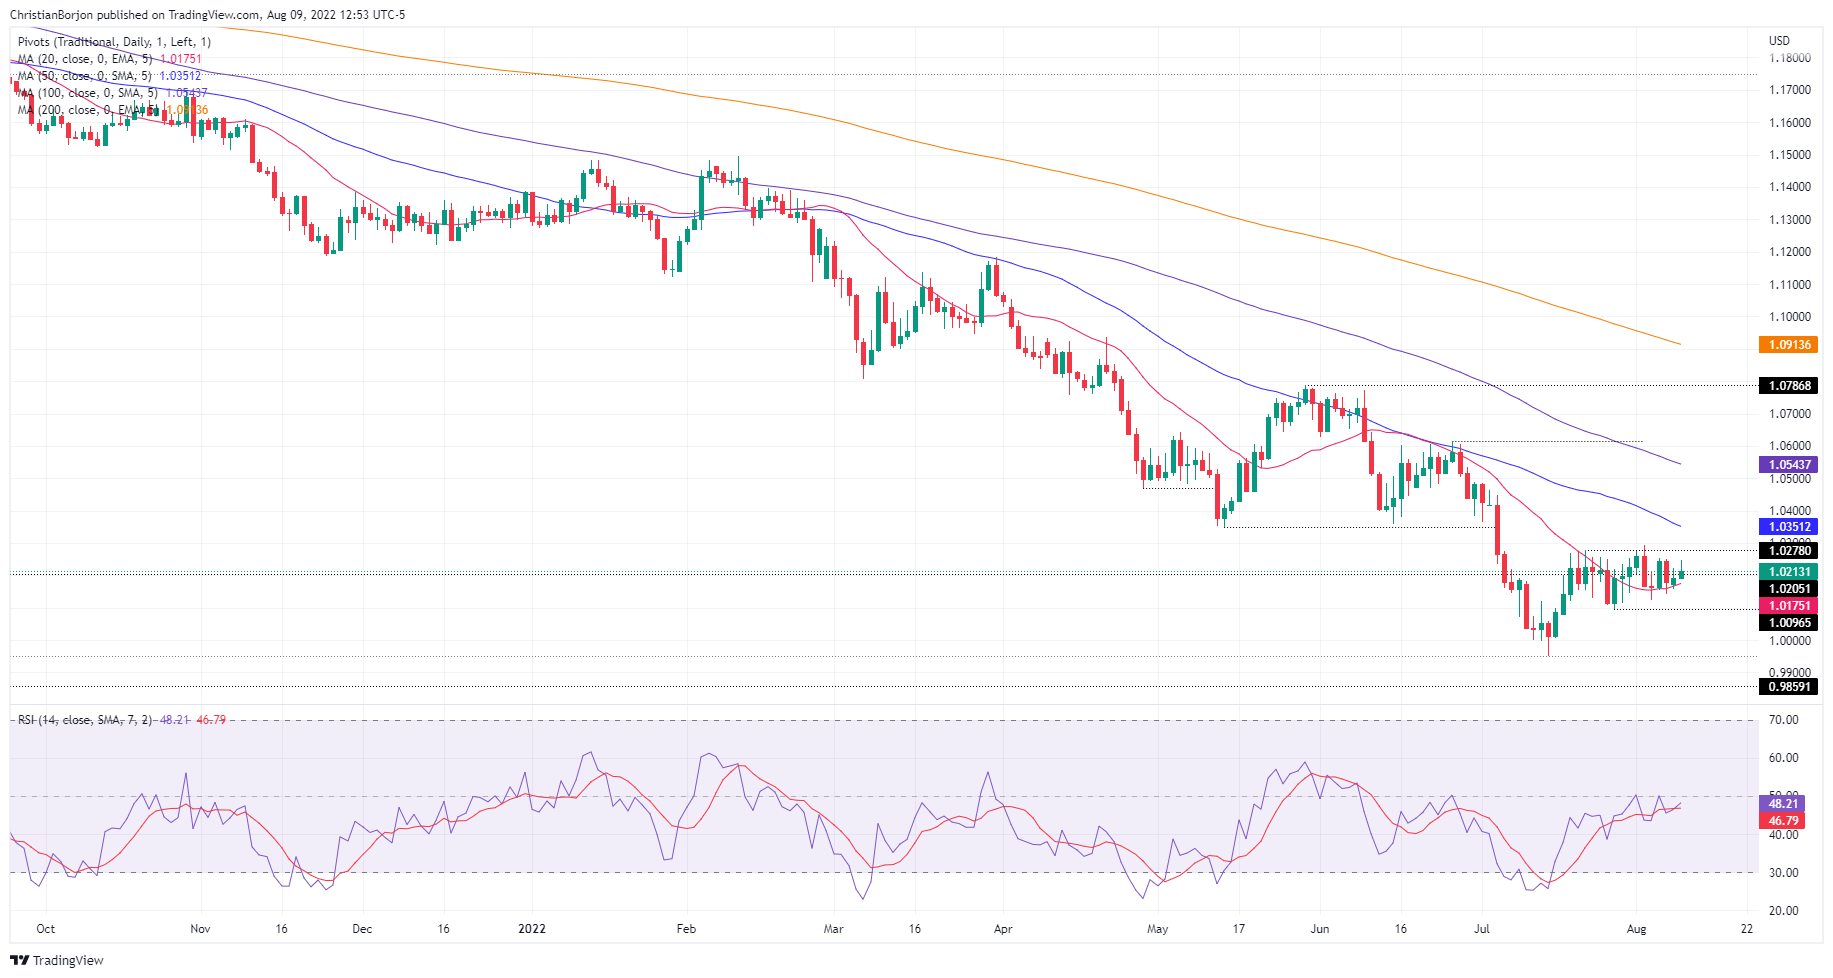
From a daily chart perspective, the EUR/USD is neutral-biased. It has been trading since July 28, above the 20-day EMA, which has been solid support, with sellers unable to break the moving average (MA) decisively. On the flip side, EUR/USD buying pressure remains constrained, with the major exchanging hands within the 1.0096-1.0293 range for at least 21-days.
However, with US data looming, investors should expect some volatility, on Wednesday’s session. Break above the top of the range will expose resistance levels at 1.0300, followed by the 50-day EMA at 1.0350 and 1.0400. On the other hand, the EUR/USD first support would be 1.0200. Once cleared, the next support would be the August 3 low at 1.0122, followed by July 27 low at 1.0096.
 EUR/USD Daily chart
© 2000-2026. All rights reserved.
This site is managed by Teletrade D.J. LLC 2351 LLC 2022 (Euro House, Richmond Hill Road, Kingstown, VC0100, St. Vincent and the Grenadines).
The information on this website is for informational purposes only and does not constitute any investment advice.
The company does not serve or provide services to customers who are residents of the US, Canada, Iran, The Democratic People's Republic of Korea, Yemen and FATF blacklisted countries.
Making transactions on financial markets with marginal financial instruments opens up wide possibilities and allows investors who are willing to take risks to earn high profits, carrying a potentially high risk of losses at the same time. Therefore you should responsibly approach the issue of choosing the appropriate investment strategy, taking the available resources into account, before starting trading.
Use of the information: full or partial use of materials from this website must always be referenced to TeleTrade as the source of information. Use of the materials on the Internet must be accompanied by a hyperlink to teletrade.org. Automatic import of materials and information from this website is prohibited.
Please contact our PR department if you have any questions or need assistance at pr@teletrade.global.


