- Analytics
- News and Tools
- Market News
- Gold Price floats above $1,685 key support, US Retail Sales, Michigan CSI eyed
Gold Price floats above $1,685 key support, US Retail Sales, Michigan CSI eyed
- Gold Price struggles to extend corrective pullback from yearly low.
- Yields, Fedspeak probes XAUUSD sellers ahead of the key US consumer-centric data.
- Updates from China, recession fears underpin bearish bias.
Gold Price (XAUUSD) fades corrective pullback from YTD low as traders struggle for clear directions above the $1,700 threshold, down 0.10% intraday around $1,710 heading into Friday’s European session. The precious metal recently fades recovery moves as traders turn cautious ahead of the key US Retail Sales for June and preliminary readings of the Michigan Consumer Sentiment Index (CSI) for July.
The XAUUSD corrective bounce, however, has roots inside the reduction in the hawkish Fed bets and easing of the inversion gap of the key US Treasury yield curves, namely between 2-year and 10-year bonds, which previously favored the risk-off mood. Also probing the gold sellers were the Fed policymakers’ attempts to talk down a 100 bps rate hike.
Also read: Gold Price Forecast: XAUUSD struggles near YTD low, further downside remains on the cards
Gold Price bears the burden of firmer DXY
US Dollar Index (DXY) reverses the previous day’s pullback from a two-decade top amid a sluggish Asian session, picking up bids to refresh the intraday high around 108.68 by the press time. In doing so, the greenback gauge portrays an inverse relationship with the Gold Price as it braces for the third consecutive weekly fall while pushing the precious metal towards the first consecutive negative week around the lowest levels in 11 months.
Easing yield curve inversion keeps XAUUSD buyers hopeful

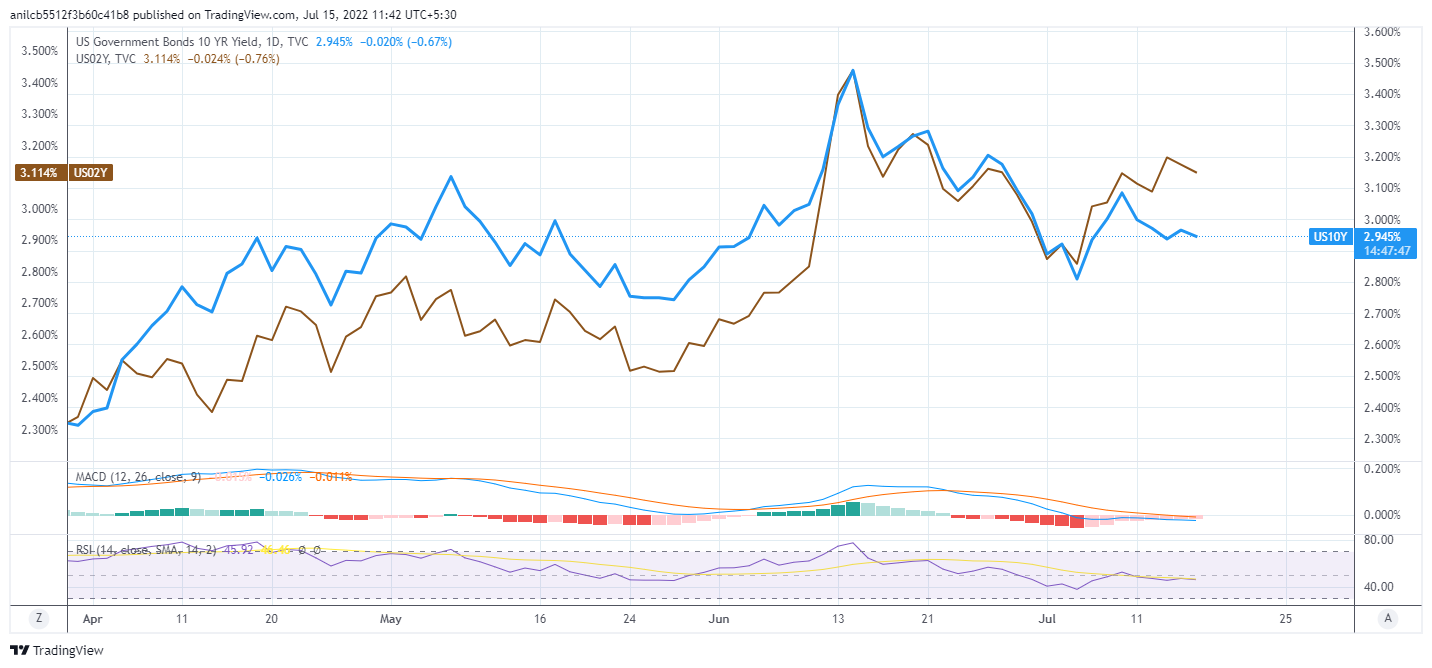
US10-year, 2-year Treasury yield curve
The recently flatlined US Treasury Yield curve appears important for Gold Price to aim for a corrective pullback. That said, US 10-year Treasury yields ended Thursday around 2.95%, up 0.95% intraday, whereas the 2-year bond coupon dropped 0.75% to 3.12% at the latest. With this, the difference between the near-term and the longer-term bond coupons declined to 17 basis points (bps) versus 23 bps inversion on Tuesday. Given the easing difference between the 2-year and the 10-year US Treasury yields, the market’s fears of recession appear abating of late, which in turn allowed the US dollar bulls to take a breather. It’s worth noting that the US 10-year Treasury yields flash 2.947% level while the 2-year bond coupon seesaws around 3.118% by the press time.
Fed speakers favored corrective pullback
Receding hawkish bias of the Fed policymakers, known as Fedspeak, appears to have recently tamed the risk-aversion wave. Among the key hurdles for the hawks were comments from St. Louis Federal Reserve President James Bullard and Federal Reserve Governor Christopher Waller. That said, Fed’s Bullard said, "So far, we've framed this mostly as 50 versus 75 at this meeting." On the same line, Fed’s Waller mentioned that markets may have gotten ahead of themselves by pricing a 100 basis points rate hike in July, as reported by Reuters. It should be noted that the Fed policymakers head to a blackout period from this weekend ahead of late July Federal Open Market Committee (FOMC).
Updates from China recall sellers
Chinese data has been mixed and recalled the gold sellers after an initial struggle. China’s Q2 Gross Domestic Product (GDP) shrank more than -1.5% expected to -2.6% QoQ, versus 1.4% prior. Further, the Industrial Production also eased but Retail Sales improved in June. Fears of covid-led lockdowns also exert downside pressure on Gold Price due to China’s status as one of the world’s biggest bullion consumers.
US data eyed for fresh impulse
Having seen firmer inflation numbers, US consumer-centric data will be important for Gold Price ahead of the Fed’s silence period before the FOMC. That said, the US Retail Sales, expected 0.8% MoM in June from -0.3% marked in May, will precede preliminary readings of the Michigan Consumer Sentiment Index (CSI) for July, expected 49.9 versus 50.0 prior, could direct intraday traders. Ahead of the release analysts at the Australia and New Zealand Banking Group said, “A strong retail sales number would be illustrative of strong demand and the need for the FOMC to maintain, and possibly intensify, its hawkish guidance.”
Gold Price technical outlook
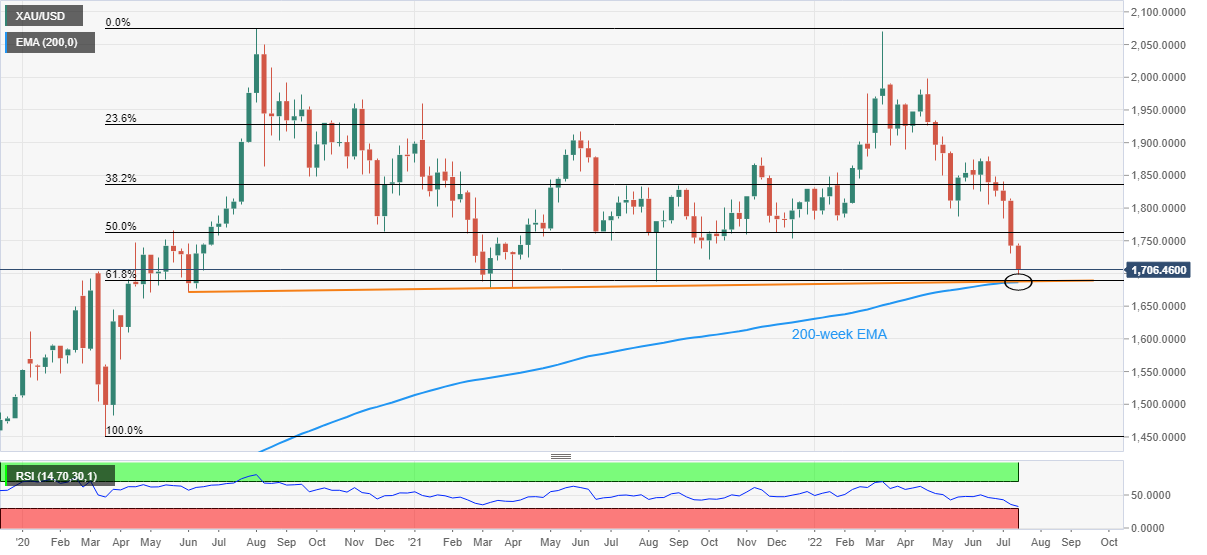
Although the oversold RSI (14) triggered Gold Price rebound from the yearly low, the XAUUSD is yet to overcome October 2021 low, around $1,722, which holds the key to the short-term upside of the metal.
Also acting as the key resistance for Gold Price is the 50% Fibonacci retracement of March-August 2020 upside, near $1,763. In a case where the metal rises past $1,763, May’s bottom surrounding $1,787 could act as the last defense of bears before welcoming the XAUUSD buyers.
Alternatively, a convergence of the 200-week EMA, 61.8% Fibonacci retracement level and an ascending support line from June 2020 constitutes $1,685 as a tough nut to crack for gold sellers.
Should the Gold Price provide a weekly closing below $1,685, the June 2020 swing low near $1,670 can offer a checking point for the bears targeting the sub-$1,600 area.

Are gold gains likley to be limited?
© 2000-2026. All rights reserved.
This site is managed by Teletrade D.J. LLC 2351 LLC 2022 (Euro House, Richmond Hill Road, Kingstown, VC0100, St. Vincent and the Grenadines).
The information on this website is for informational purposes only and does not constitute any investment advice.
The company does not serve or provide services to customers who are residents of the US, Canada, Iran, The Democratic People's Republic of Korea, Yemen and FATF blacklisted countries.
Making transactions on financial markets with marginal financial instruments opens up wide possibilities and allows investors who are willing to take risks to earn high profits, carrying a potentially high risk of losses at the same time. Therefore you should responsibly approach the issue of choosing the appropriate investment strategy, taking the available resources into account, before starting trading.
Use of the information: full or partial use of materials from this website must always be referenced to TeleTrade as the source of information. Use of the materials on the Internet must be accompanied by a hyperlink to teletrade.org. Automatic import of materials and information from this website is prohibited.
Please contact our PR department if you have any questions or need assistance at pr@teletrade.global.


