- Analytics
- News and Tools
- Market News
- AUD/JPY Price Analysis: A rising wedge in the daily chart, targets a fall towards 86.20s
AUD/JPY Price Analysis: A rising wedge in the daily chart, targets a fall towards 86.20s
- The AUD/JPY registered gains of almost 1.50% in June.
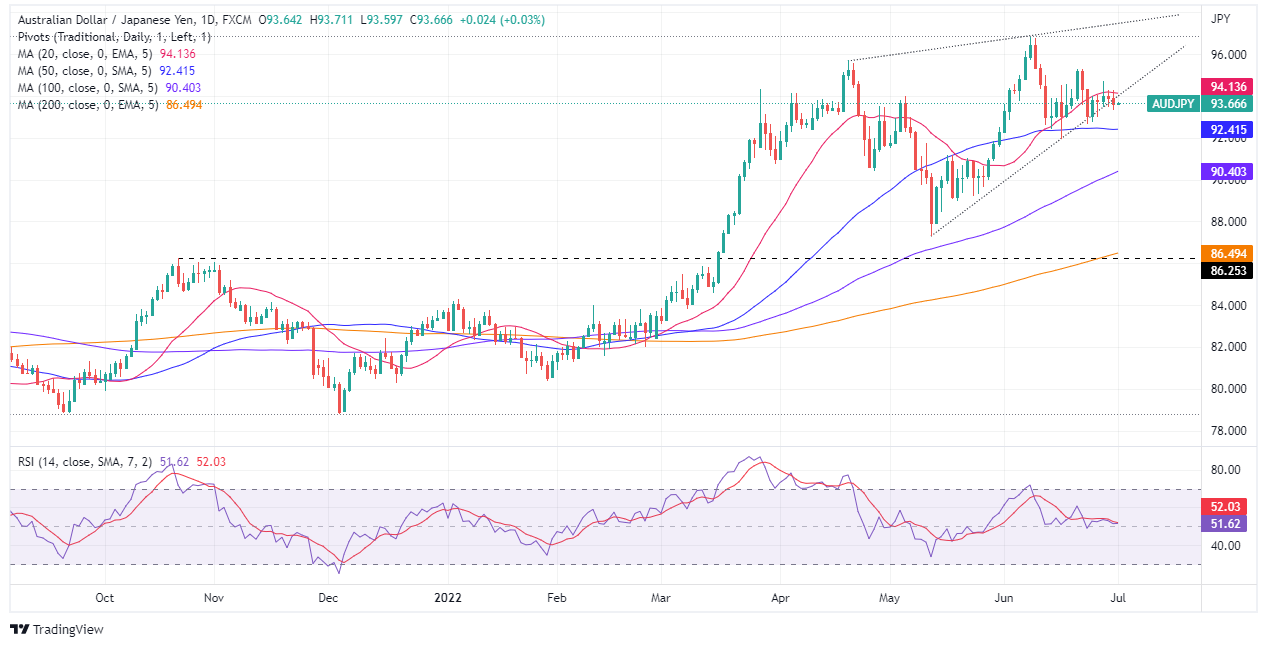
- A rising wedge in the AUD/JPY’s daily chart targets a fall towards 86.20s.
- The AUD/JPY in the near term is neutral-downward biased.
AUD/JPY prolongs its losses amidst a risk-off impulse weighing on global equities, sending investors scrambling toward safe-haven assets; in the FX complex being the Japanese yen and the Swiss franc, except the US dollar, undermined by falling US Treasury yields. At 93.67, the AUD/JPY is almost flat as the Asian Pacific session begins.
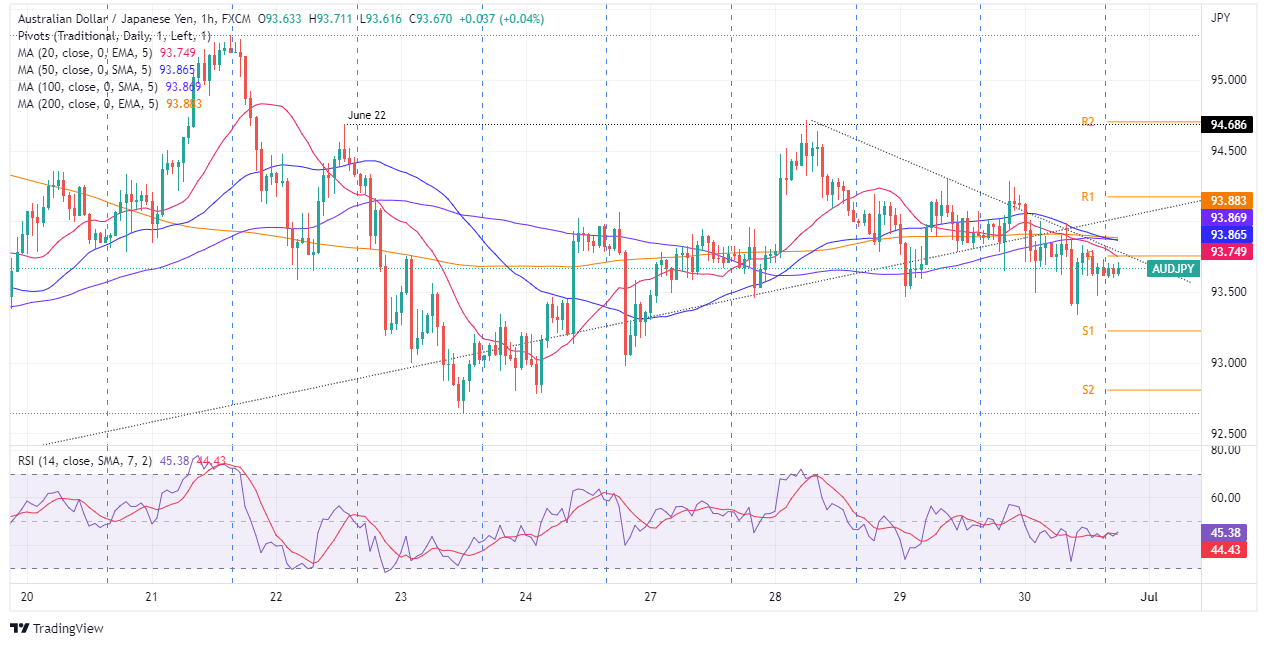
AUD/JPY Thursday’s price action illustrates consolidation in the last few days, within the 93.40-94.30 range, which buyers/sellers have been unable to break. AUD/JPY traders should note that the cross exchange rate is below the exponential moving averages (EMAs) in the 1-hour chart, signifying that downside risks remain in the short term.
AUD/JPY Daily chart
The AUD/JPY daily chart illustrates that the uptrend remains in play. Nevertheless, the pair’s falling below the 20-day EMA leaves it vulnerable to selling pressure, but the “damage” could be limited by the 50-day EMA at 92.41, followed by the June 16 swing low at 91.96. If that scenario plays out, it will also confirm the break of a rising wedge that targets the October 21, 2021 swing high-turned-support at 86.25.

AUD/JPY 1-Hour chart
In the near term, the AUD/JPY depicts a neutral-downward bias, confirmed by the EMAs and the Relative Strenght Index (RSI), which albeit almost trendless, remains below the 50-midline, in negative territory. Furthermore, a four-times tested downslope trendline suggests the pair is consolidating.
If the AUD/JPY breaks to the downside, its first support would be the June 30 daily low at 93.33. Once cleared, it would expose the S1 daily pivot at 93.23, followed by the June 26 low at 92.97. Contrarily, if the cross heads north, the AUD/JPY’s first resistance would be the 20-EMA at 93.74. Break above would expose the confluence of the 50, 100, and 200-EMAs, in the 93.85-88 range, followed by the R1 daily pivot at 94.20, followed by the June 22 high at 94.68.

AUD/JPY Key Technical Levels
© 2000-2026. All rights reserved.
This site is managed by Teletrade D.J. LLC 2351 LLC 2022 (Euro House, Richmond Hill Road, Kingstown, VC0100, St. Vincent and the Grenadines).
The information on this website is for informational purposes only and does not constitute any investment advice.
The company does not serve or provide services to customers who are residents of the US, Canada, Iran, The Democratic People's Republic of Korea, Yemen and FATF blacklisted countries.
Making transactions on financial markets with marginal financial instruments opens up wide possibilities and allows investors who are willing to take risks to earn high profits, carrying a potentially high risk of losses at the same time. Therefore you should responsibly approach the issue of choosing the appropriate investment strategy, taking the available resources into account, before starting trading.
Use of the information: full or partial use of materials from this website must always be referenced to TeleTrade as the source of information. Use of the materials on the Internet must be accompanied by a hyperlink to teletrade.org. Automatic import of materials and information from this website is prohibited.
Please contact our PR department if you have any questions or need assistance at pr@teletrade.global.


