- Analytics
- News and Tools
- Market News
- EUR/JPY Price Analysis: Trims three days of losses and reclaims 141.00 on a risk-off mood
EUR/JPY Price Analysis: Trims three days of losses and reclaims 141.00 on a risk-off mood
- The euro recovered some ground vs. the Japanese yen amidst the scenario of Japanese authorities intervening in the FX markets.
- EUR/JPY Price Analysis: The formation of a bearish flag pattern in the 1-hour chart would open the door for further losses.
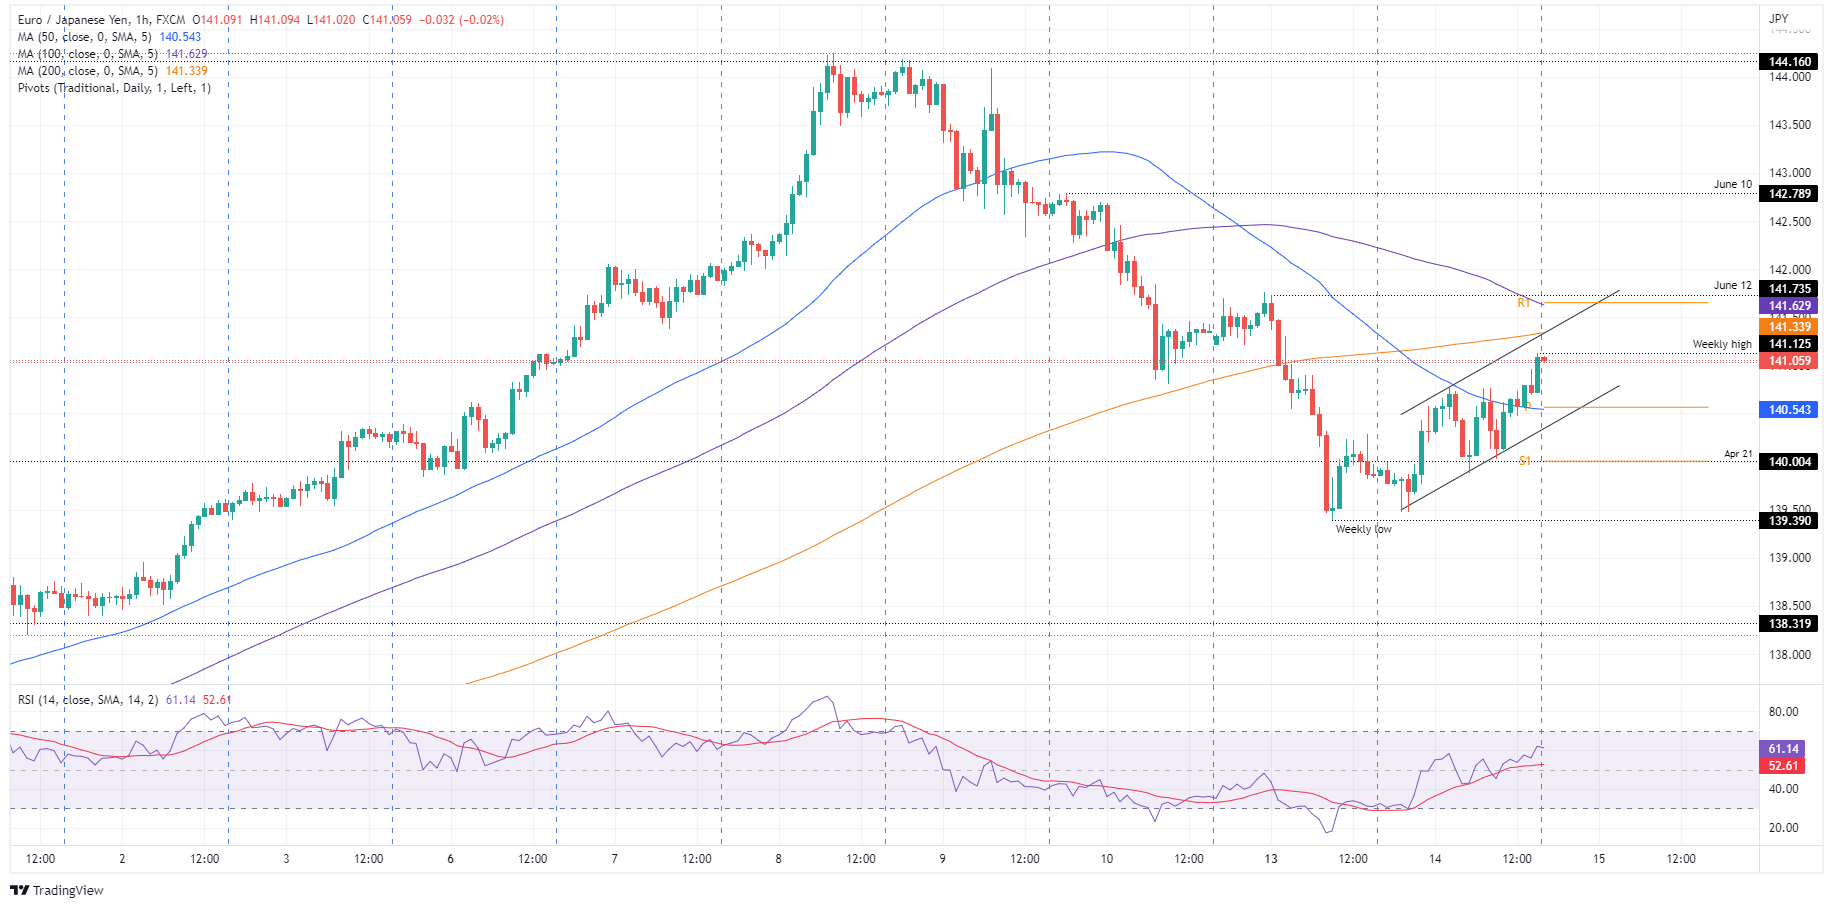
The EUR/JPY is snaping three days of consecutive losses, courtesy of last Friday’s verbal intervention by Japanese authorities, which spurred a dip from YTD highs at around 144.18 to 139.38, almost a 500 pip fall. However, on Tuesday, the EUR/JPY is recovering and erases 150 pips of losses, gaining 1.06%, and is trading at 141.06, as the New York session winds down.
Sentiment remains negative. Expectations that the US Federal Reserve would hike 75 bps mounted. Banks in Wall Street updated their Fed calls on Tuesday after an article by the WSJ that stated that due to high inflationary indicators, the US central bank would “surprisingly” hike 75 bps.
The aforementioned triggered a bloodbath in global equities, which remain on the defensive. US Treasury yields remain elevated, and the greenback rose.
The EUR/JPY got a boost, despite a dismal than expected EU data. As expected, inflation in Germany rose by 7.9% YoY in May, alongside other inflationary numbers that came in line as estimated. However, the Zew Economic Sentiment Index in the Euro area and Germany missed expectations. Nevertheless, it was ignored by traders.
EUR/JPY Price Analysis: Technical outlook
The EUR/JPY’s daily chart depicts the cross-currency as upward biased, but the RSI, albeit in the bullish territory, is trendless. That said, the EUR/JPY might consolidate in the near term in the 139.40-141.00 area.
The EUR/JPY’s 1-hour chart illustrates that the pair is confined to an uptrend channel, forming a bearish flag. Nevertheless, a break above the bearish flag-top trendline, which confluences with the 200-hour simple moving average (SMA) at 141.34, would open the door for a test of June’s 12 high, which confluences with the 100-hour SMA and the R1 daily pivot point around 141.76. If that scenario is completed, the following resistance would be June’s 10 high at 142.79.
However, the EUR/JPY path of least resistance is downwards. The EUR/JPY’s first support would be the confluence of the 50-hour SMA and the daily pivot at around 140.54. Break below would expose the bottom trendline of the bearish flag around 140.30-40, followed by the S1 daily pivot at 140.00.

Key Technical Levels
© 2000-2026. All rights reserved.
This site is managed by Teletrade D.J. LLC 2351 LLC 2022 (Euro House, Richmond Hill Road, Kingstown, VC0100, St. Vincent and the Grenadines).
The information on this website is for informational purposes only and does not constitute any investment advice.
The company does not serve or provide services to customers who are residents of the US, Canada, Iran, The Democratic People's Republic of Korea, Yemen and FATF blacklisted countries.
Making transactions on financial markets with marginal financial instruments opens up wide possibilities and allows investors who are willing to take risks to earn high profits, carrying a potentially high risk of losses at the same time. Therefore you should responsibly approach the issue of choosing the appropriate investment strategy, taking the available resources into account, before starting trading.
Use of the information: full or partial use of materials from this website must always be referenced to TeleTrade as the source of information. Use of the materials on the Internet must be accompanied by a hyperlink to teletrade.org. Automatic import of materials and information from this website is prohibited.
Please contact our PR department if you have any questions or need assistance at pr@teletrade.global.


