- Analytics
- News and Tools
- Market News
- Silver Price Forecast: XAG/USD slumps but remains firm at around $22.10s ahead of US inflation data
Silver Price Forecast: XAG/USD slumps but remains firm at around $22.10s ahead of US inflation data
- Silver is trading positive during the week, up by 1.12%.
- On Wednesday, high US Treasury yields and a solid greenback weigh on silver
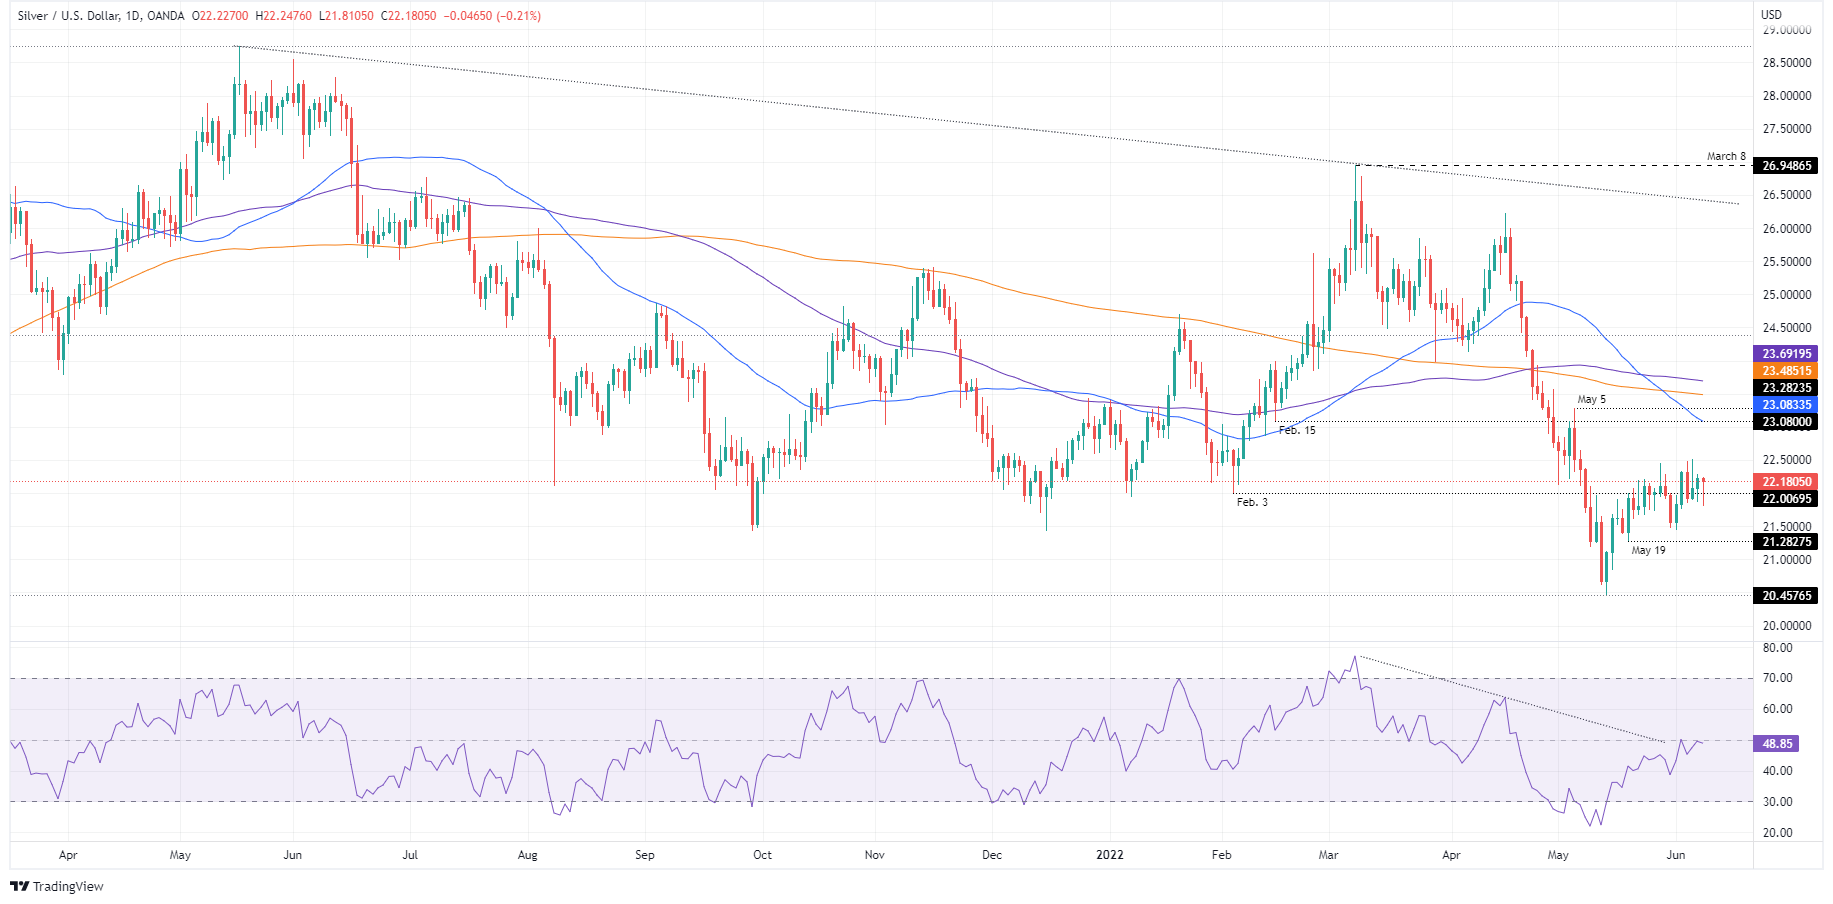
- Silver Price Forecast (XAG/USD): Remains range-bound, trading between $21.28-$22.50 in the last month.
Silver (XAG/USD) slides from June 7 highs at around $22.28, courtesy of higher US Treasury yields and a steady greenback amidst a risk-off market mood, which has investors scrambling to safe-haven assets, but the precious metals complex. At $22.18, XAG/USD grinds lower by 0.39% at the time of writing.
Higher US Treasury yields and a solid greenback weigh on silver
The US Dollar Index, a gauge of the buck’s value vs. a basket of its rivals, is almost flat in the day, though slightly positive, at 102.342, recovering from earlier losses that dragged prices towards 102.269. The US 10-year benchmark note rate sits at 3%, gaining two-basis points, a headwind for silver prices.
European and US equities are falling, reflecting a dismal sentiment, weighed by rising bond yields. Investors assess global central banks tightening monetary conditions. As of Thursday, the European Central Bank (ECB) will be the next in line; though it is expected to hold rates unchanged, an announcement of the end of the APP can lay the ground for the first-rate hike in the July meeting.
Elsewhere, the OECD is the following international organization that shrank the expectations for a higher global economic growth rate. By 2022, the OECD estimates growth at 3.0%, lower than the 4.5% estimated, and by 2023, it will hit 2.8% YoY, less than the 3.2% foreseen.
In the meantime, XAG/USD prices remain on the defensive after opening above $22.20. As soon as Wednesday’s Asian session kicked in, prices fell, though the non-yielding metal reclaimed $22.00 after reaching a daily low near $21.80.
In the week ahead, the US calendar will feature Initial Jobless Claims for the week ending on June 4, followed by consumer inflation data, alongside the University of Michigan’s Consumer Sentiment.
Silver Price Forecast (XAG/USD): Technical outlook
XAG/USD remains ina a choppy trading range since May 19. Pressured by a fragile mood and elevated US Treasury yields, silver traders could not break above/below the $21.28-$22.50 range. The Relative Strength Index (RSI) at 48.63 is trendless, portraying silver’s price behavior.
Upwards the XAG/USD’s first resistance would be the June 6, high at $22.51. Break above would expose the 50-day moving average (DMA) at $23.08, followed by the May 5 swing high at $23.28. On the flip side, the XAG/USD’s first support would be $22.00. Once cleared, the following demand area would be the June 1 swing low at $21.43, followed by the May 19 low at $21.28.

© 2000-2026. All rights reserved.
This site is managed by Teletrade D.J. LLC 2351 LLC 2022 (Euro House, Richmond Hill Road, Kingstown, VC0100, St. Vincent and the Grenadines).
The information on this website is for informational purposes only and does not constitute any investment advice.
The company does not serve or provide services to customers who are residents of the US, Canada, Iran, The Democratic People's Republic of Korea, Yemen and FATF blacklisted countries.
Making transactions on financial markets with marginal financial instruments opens up wide possibilities and allows investors who are willing to take risks to earn high profits, carrying a potentially high risk of losses at the same time. Therefore you should responsibly approach the issue of choosing the appropriate investment strategy, taking the available resources into account, before starting trading.
Use of the information: full or partial use of materials from this website must always be referenced to TeleTrade as the source of information. Use of the materials on the Internet must be accompanied by a hyperlink to teletrade.org. Automatic import of materials and information from this website is prohibited.
Please contact our PR department if you have any questions or need assistance at pr@teletrade.global.


