- Analytics
- News and Tools
- Market News
- Gold Price Forecast: XAU/USD bears eye $1,832-34 support zone even as market pessimism recedes
Gold Price Forecast: XAU/USD bears eye $1,832-34 support zone even as market pessimism recedes
- Gold bears slow down around the key horizontal support after posting the biggest daily fall in a week.
- Pullback in yields probe commodity bears even as US stock futures remain pressured.
- Inflation, covid and geopolitics are crucial factors to watch for fresh impulse.
- Gold Price Forecast: Unbeatable dollar set to keep appreciating
Having dropped the most in a week, gold (XAU/USD) prices seesaw around the short-term key horizontal support area near $1,850 as market sentiment dwindles during early Tuesday. Even so, the yellow metal remains on the bear’s radar as fears surrounding inflation and growth remain on the table, as well as due to the quote’s first daily closing below 200-day EMA since late January.
Although the US stock futures track Wall Street’s losses by dropping half a percent by the press time, a pullback in the Treasury yields seemed to have probed the market pessimism of late. That said, the US 10-year Treasury yields drop back to sub-3.0% levels after rising to the fresh high since November 2018 the previous day.
Mixed comments from the Fed policymakers could be spotted as weighing on the Treasury yields of late. That said, Richmond Fed President Thomas Barkin kept the 75 bps rate hike on the table while Atlanta Fed’s Robert Bostic promoted a series of 50bps rate lifts.
Also likely to have probed the further downside of the metal are comments from China’s Vice Premier Liu He who reiterates the country’s dynamic covid zero policy.
It’s worth noting that growing concerns over the economic growth, as rallying inflation pushes central bankers towards tighter monetary policies, seemed to have portrayed a stellar show of risk-aversion on Monday. Adding to the sour sentiment were worsening covid conditions in China and Russia’s ignorance of global ire over the invasion of Ukraine.
Looking forward, gold traders should pay attention to the risk catalysts for fresh impulse ahead of the US Consumer Price Index (CPI) data for April, scheduled for release on Wednesday.
Technical analysis
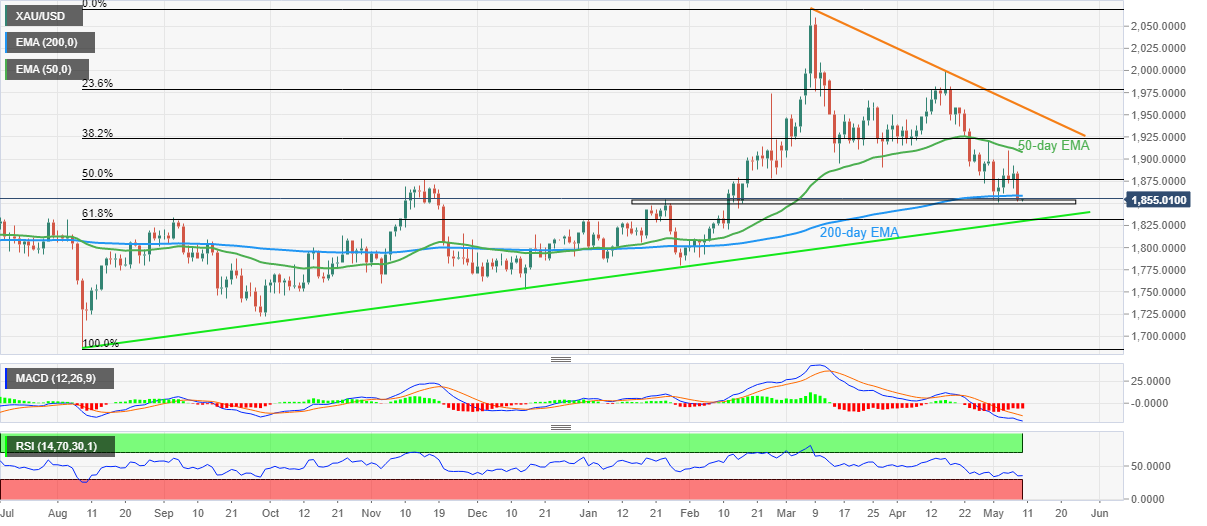
Although a horizontal area comprising multiple levels marked since late January challenges gold sellers around $1,850, a daily closing below the 200-day EMA and an absence of oversold RSI, as well as bearish MACD signals, suggest further downside of the bright metal.
However, a convergence of an upward sloping trend line from August 2021 and 61.8% Fibonacci retracement of August 2021 to March 2022 upside, near $1,832-34, appears a tough nut to crack for the gold bears.
Alternatively, corrective pullback needs validation from the 200-day EMA level surrounding $1,860.
Even so, the 50-day EMA and a descending trend line from March, respectively around $1,908 and $1,960, could challenge gold buyers.
Gold: Daily chart

Trend: Further weakness expected
© 2000-2026. All rights reserved.
This site is managed by Teletrade D.J. LLC 2351 LLC 2022 (Euro House, Richmond Hill Road, Kingstown, VC0100, St. Vincent and the Grenadines).
The information on this website is for informational purposes only and does not constitute any investment advice.
The company does not serve or provide services to customers who are residents of the US, Canada, Iran, The Democratic People's Republic of Korea, Yemen and FATF blacklisted countries.
Making transactions on financial markets with marginal financial instruments opens up wide possibilities and allows investors who are willing to take risks to earn high profits, carrying a potentially high risk of losses at the same time. Therefore you should responsibly approach the issue of choosing the appropriate investment strategy, taking the available resources into account, before starting trading.
Use of the information: full or partial use of materials from this website must always be referenced to TeleTrade as the source of information. Use of the materials on the Internet must be accompanied by a hyperlink to teletrade.org. Automatic import of materials and information from this website is prohibited.
Please contact our PR department if you have any questions or need assistance at pr@teletrade.global.


