- Analytics
- News and Tools
- Market News
- Silver Price Forecast: XAG/USD bulls march firmly towards $26.00 on a soft greenback
Silver Price Forecast: XAG/USD bulls march firmly towards $26.00 on a soft greenback
- A positive market mood, falling US bond yields, and a weaker buck, a tailwind for precious metals and commodities.
- Hotter than expected, US PPI inflation reinforces a 50-bps increase by the Fed.
- Silver Price Forecast (XAG/USD): Remains upward biased, and a daily close above $25.85 would open the door for bulls towards $26.00
Silver (XAG/USD) rallies for the sixth consecutive day, in the middle of an upbeat market mood, taking advantage of fallings US Treasury yields, high US inflation figures, and despite the continuation of hostilities between Ukraine-Russia. At the time of writing, XAG/USD is trading at $25.72 and continues to aim towards $26.00.
Risk appetite increased throughout the North American session, as portrayed by US equities gaining. US Treasury yields fell, with the 10-year clinging to the 2.70% threshold, while the greenback fell.
High US inflation lays the ground for a Federal Reserve 50 bps hike
The ongoing week US economic docket keeps traders entertained. On Wednesday, consumer inflation rose to 8.5% y/y, higher than estimations but within the range. At the same time, the so-called core Consumer Price Index (CPI) increased 6.5% y/y, though lower than the 6.7% expected, a signal that inflation might be about to peak.
Nevertheless, prices paid for producers sent the hopes over the board on Thursday. The Producer Price Index (PPI) expanded by 11.2%, higher than the 10.8% y/y estimations, while core PPI hit 9.2% y/y, substantially up than the 8.4% estimations.
With both reports in the rearview mirror reinforces pressure on the Federal Reserve to raise rates at a faster pace. Fed officials have opened the door for 50-bps rate hikes at its May meeting, while STIRs shows a 94% chance of a 0.50% lift to the Federal Funds Rate (FFR).
Elsewhere precious metals extend their gains in the week. Silver is up close to 4%, while Gold gains 1.5%, trading at $1976 a troy ounce.
The US economic docket would unveil Retail Sales, Initial Jobless Claims, and the University of Michigan Consumer Sentiment survey by Thursday.
Silver Price Forecast (XAG/USD): Technical outlook
Silver’s (XAG/USD) daily chart depicts the pair as upward biased. The daily moving averages (DMAs) below the spot price confirmed the previously mentioned, though it’s worth noting that the 200-DMA at $23.89 is trapped between the 50-DMA at $24.61 and the 100-DMA at $23.74.
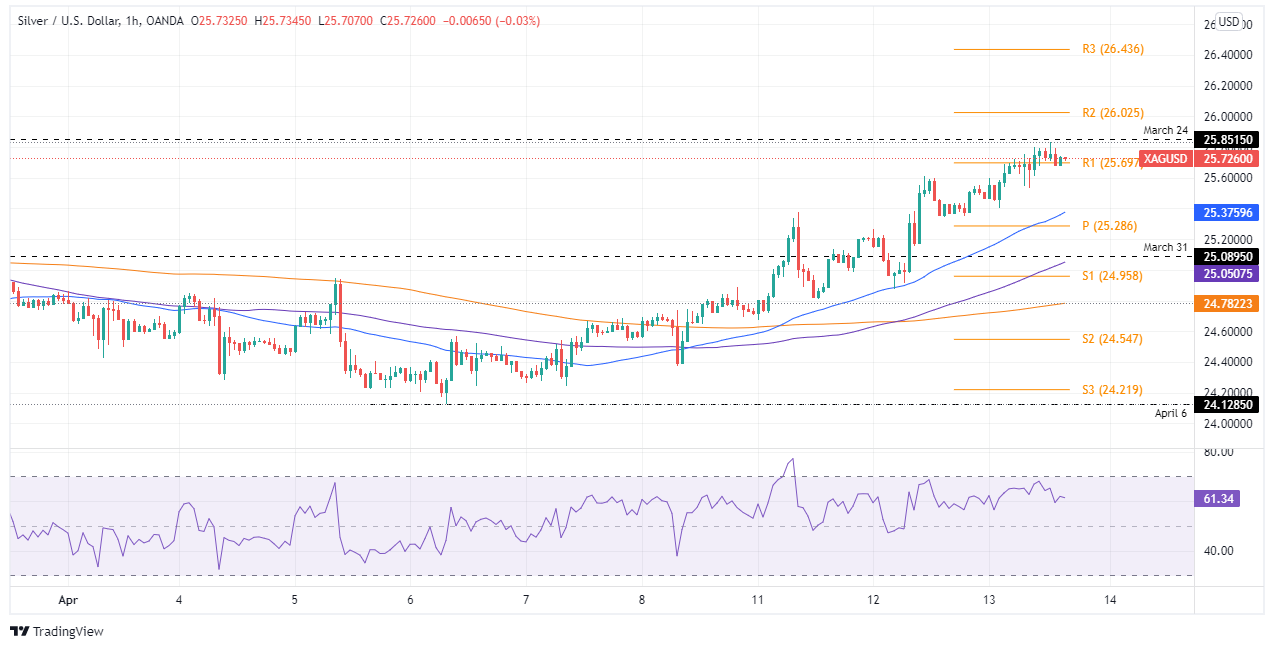
Silver’s 1-hour chart bias is aligned with the daily chart, and the uptrend is intact. The price action of the last two candlesticks shows that the rally is overextended, further confirmed by the Relative Strength Index (RSI) at 61.63, close to reaching overbought conditions.
Upwards, the XAG/USD first resistance would be the confluence of the March 24 cycle high and the R1 pivot point around the $25.75-85 range. A breach of the latter would expose the psychological $26.00 mark, followed by the R3 pivot at $26.43.
On the downside, the XAG/USD first support would be the 50-hour simple moving average (SMA) at $25.37. Once cleared, the next support would be the confluence of March 31 and the 100-hour SMA around the $25.05-09 range, followed by the 200-hour SMA at $24.78.

© 2000-2026. All rights reserved.
This site is managed by Teletrade D.J. LLC 2351 LLC 2022 (Euro House, Richmond Hill Road, Kingstown, VC0100, St. Vincent and the Grenadines).
The information on this website is for informational purposes only and does not constitute any investment advice.
The company does not serve or provide services to customers who are residents of the US, Canada, Iran, The Democratic People's Republic of Korea, Yemen and FATF blacklisted countries.
Making transactions on financial markets with marginal financial instruments opens up wide possibilities and allows investors who are willing to take risks to earn high profits, carrying a potentially high risk of losses at the same time. Therefore you should responsibly approach the issue of choosing the appropriate investment strategy, taking the available resources into account, before starting trading.
Use of the information: full or partial use of materials from this website must always be referenced to TeleTrade as the source of information. Use of the materials on the Internet must be accompanied by a hyperlink to teletrade.org. Automatic import of materials and information from this website is prohibited.
Please contact our PR department if you have any questions or need assistance at pr@teletrade.global.


