- Analytics
- News and Tools
- Market News
- Gold Price Analysis: XAU/USD stuck in a sideways range
Gold Price Analysis: XAU/USD stuck in a sideways range
- Gold holds in a tight range and awaits a catalyst.
- Fed rhetoric is boosting the US dollar and weighing on gold.
- XAU/USD to remain bearish amid rising US yields.
The gold price was a touch lower as the US dollar weighed. The greenback hit its highest level in nearly two years as measured by the DXY index vs. a basket of other currencies. A more hawkish Fed also saw the benchmark 10-year Treasury yield run to 2.55% while the two-years hit 2.56% for the first time since March 2019.
Spot gold was down 0.3% at $1,916 per ounce, but trading in a narrow range while US gold futures eased 0.1% to $1,931.20. At the time of writing, XAU/USD is down 0.2% at $1,921 and weighed in Asia following comments from Federal Reserve Governor Lael Brainard.
The Fed member spoke of potential aggressive action from the Fed in anticipation of hawkish minutes tomorrow. Brainard said the central bank could start reducing its balance sheet as soon as May and would be doing so at “a rapid pace.” Brainard added that interest rate hikes could come at a more aggressive pace than the typical increments of 0.25 percentage points.
Eyes on the Fed
Meanwhile, the Fed officials began the process of policy normalization by lifting rates 25bp to 0.25%-0.50% at the March meeting and on Wednesday the minutes of that meeting will be released.
''The FOMC pull no hawkish punches in its policy guidance, with Chair Powell also hinting further information about QT plans will be provided in the minutes (possibly including caps details). We continue to expect an official QT announcement at the May FOMC meeting,'' analysts at TD Securities said.
''Gold prices have remained incredibly resilient, reflecting that strong ETF and comex inflows into gold are trumping outflows associated with a hawkish Fed, which is in turn creating a divergence between gold and rates markets,'' analysts at TD Securities said.
''Considering that real rates could be less useful as a barometer for measuring gold's relative price, we turn our attention to gold flows to gauge the sustainability of interest in the yellow metal. Our analysis highlighted ETF flows have tended to be more highly correlated to changes in market expectations for Fed hiking, than to real rates, the yield curve or even price momentum.
This still suggests that the strong ETF inflows have rather been associated with safe-haven appetite, which could still lead to downside risks as the negotiators continue to work towards a ceasefire and as the fear trade subsidies.''
Gold, technical analysis
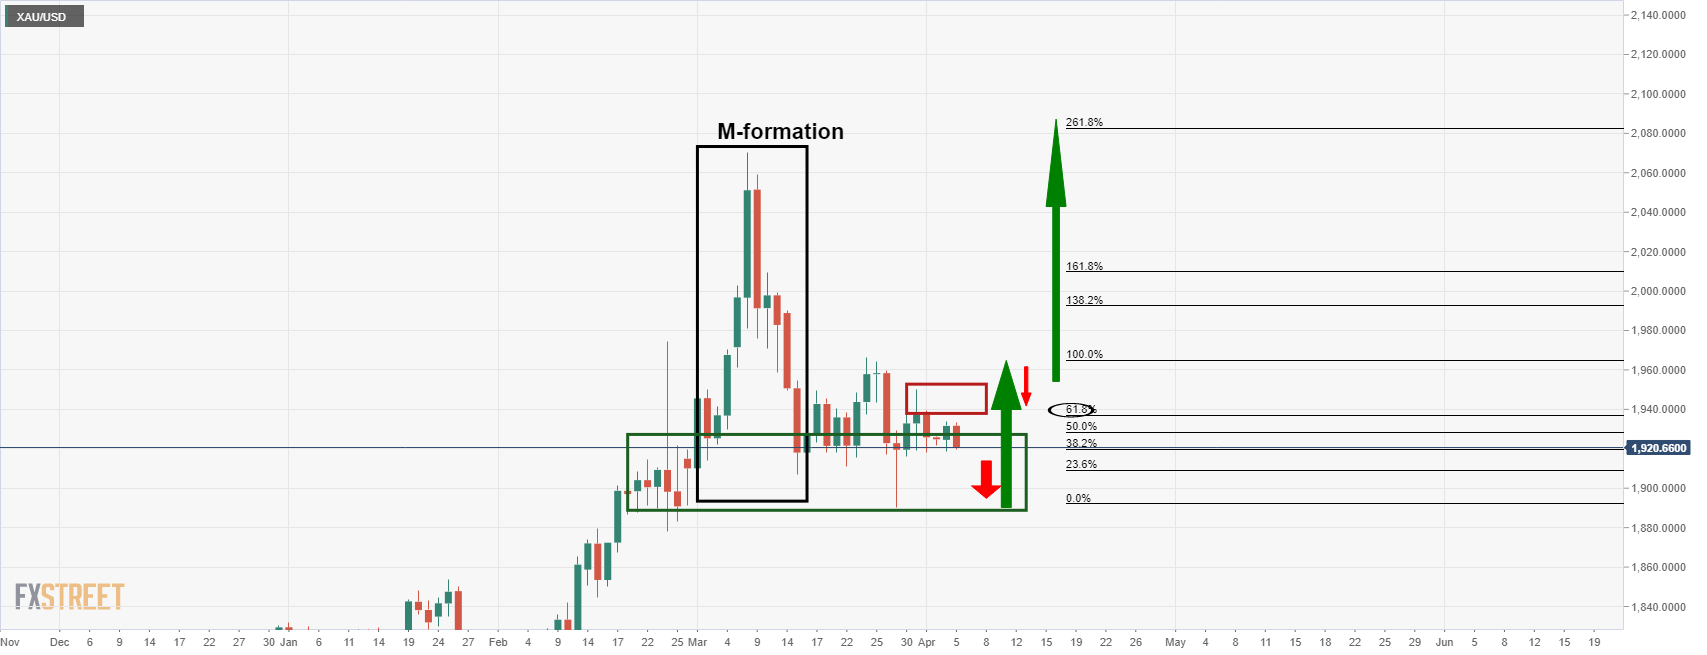
As per the pre-open analysis, Chart of the Week, Gold: XAU/USD is pressured for the open ...

... the M-formation is a bullish reversion pattern and the price would be expected to be attracted to the neckline between $1,980 and $2,000. However, the sideways consolidation has played out to the point that there appears to be a bias to the downside for the near term where gold is being resisted by a 61.8% Fibo currently.
© 2000-2026. All rights reserved.
This site is managed by Teletrade D.J. LLC 2351 LLC 2022 (Euro House, Richmond Hill Road, Kingstown, VC0100, St. Vincent and the Grenadines).
The information on this website is for informational purposes only and does not constitute any investment advice.
The company does not serve or provide services to customers who are residents of the US, Canada, Iran, The Democratic People's Republic of Korea, Yemen and FATF blacklisted countries.
Making transactions on financial markets with marginal financial instruments opens up wide possibilities and allows investors who are willing to take risks to earn high profits, carrying a potentially high risk of losses at the same time. Therefore you should responsibly approach the issue of choosing the appropriate investment strategy, taking the available resources into account, before starting trading.
Use of the information: full or partial use of materials from this website must always be referenced to TeleTrade as the source of information. Use of the materials on the Internet must be accompanied by a hyperlink to teletrade.org. Automatic import of materials and information from this website is prohibited.
Please contact our PR department if you have any questions or need assistance at pr@teletrade.global.


