- Analytics
- News and Tools
- Market News
- US Dollar Index retests 96.00 on higher CPI, yields
US Dollar Index retests 96.00 on higher CPI, yields
- DXY moves higher and flirts with the 96.00 barrier.
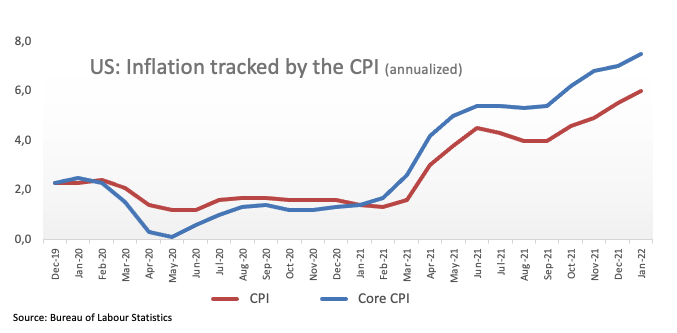
- US headline CPI rose 7.5% YoY in January.
- US Initial Claims increased by 223K WoW.
The US Dollar Index (DXY), which tracks the greenback vs. a bundle of its main competitors, leaps to fresh tops in the boundaries of the 96.00 zone on Thursday.
US Dollar Index stronger after hottest CPI in 4 decades
The index quickly climbed to multi-day highs after US inflation figures rose at the fastest pace in 40 years at 7.5% in January. In the same line, core prices – excluded energy and food costs – rose to 6.0% over the last twelve months.

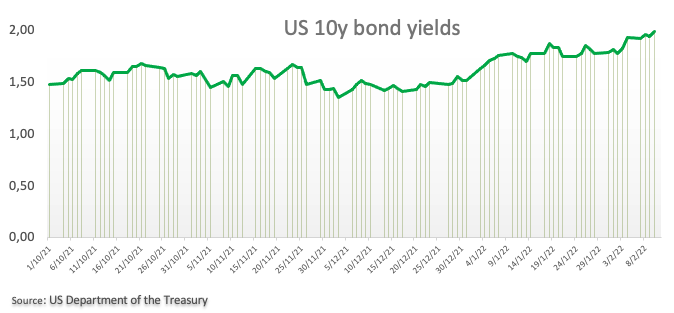
The strong CPI print immediately morphed into further upside in US yields across the curve, where the 10y benchmark note tested – albeit ephemerally – the psychological 2.00% yardstick.

Further results from the US docket showed Initial Claims also coming in above expectations after rising 223K in the week to February 5.
The move higher in US yields responded to now rising speculation of a potential 50 bps interest rate hike at the FOMC event in March. That said, and according to CME Group’s FedWatch tool, the probability of such a raise next month is now just above 50% (from 24% on February 9).
What to look for around USD
Higher-than-expected US inflation figures lent extra oxygen to the greenback and propelled DXY back to the 96.00 neighbourhood. However, the extent and duration of this improvement in the dollar remains to be seen, as much of the current elevated inflation narrative was already priced in by market participants as well as the probability (bigger now) of a 50 bps rate hike by the Fed (instead of the more conventional 25 bps move). Looking at the longer run, and while the constructive outlook for the greenback appears well in place for the time being, recent hawkish messages from the BoE and the ECB carry the potential to undermine the expected move higher in the dollar in the next months.
Key events in the US this week: Flash Consumer Sentiment (Friday).
Eminent issues on the back boiler: Fed’s rate path this year. US-China trade conflict under the Biden administration. Debt ceiling issue. Escalating geopolitical effervescence vs. Russia and China.
US Dollar Index relevant levels
Now, the index is gaining 0.26% at 95.80 and a break above 96.00 (weekly high Feb.10) would open the door to 97.44 (2022 high Jan.28) and finally 97.80 (high Jun.30 2020). On the flip side, the next down barrier emerges at 95.28 (100-day SMA) followed by 95.13 (weekly low Feb.4) and then 94.62 (2022 low Jan.14).
© 2000-2026. All rights reserved.
This site is managed by Teletrade D.J. LLC 2351 LLC 2022 (Euro House, Richmond Hill Road, Kingstown, VC0100, St. Vincent and the Grenadines).
The information on this website is for informational purposes only and does not constitute any investment advice.
The company does not serve or provide services to customers who are residents of the US, Canada, Iran, The Democratic People's Republic of Korea, Yemen and FATF blacklisted countries.
Making transactions on financial markets with marginal financial instruments opens up wide possibilities and allows investors who are willing to take risks to earn high profits, carrying a potentially high risk of losses at the same time. Therefore you should responsibly approach the issue of choosing the appropriate investment strategy, taking the available resources into account, before starting trading.
Use of the information: full or partial use of materials from this website must always be referenced to TeleTrade as the source of information. Use of the materials on the Internet must be accompanied by a hyperlink to teletrade.org. Automatic import of materials and information from this website is prohibited.
Please contact our PR department if you have any questions or need assistance at pr@teletrade.global.


