- Analytics
- News and Tools
- Market News
- USD/CAD Price Analysis: Bulls looking to build on the recovery beyond 1.2800 mark
USD/CAD Price Analysis: Bulls looking to build on the recovery beyond 1.2800 mark
- USD/CAD staged a modest recovery from a near two-month-old ascending channel support.
- Bullish crude oil prices might underpin the loonie and cap any meaningful gains for the pair.
- A convincing break below the 1.2770-65 area will set the stage for a further near-term slide.
The USD/CAD pair staged a goodish bounce from a one-and-half-week low touched earlier this Tuesday and climbed to the 1.2800 mark during the first half of the European session.
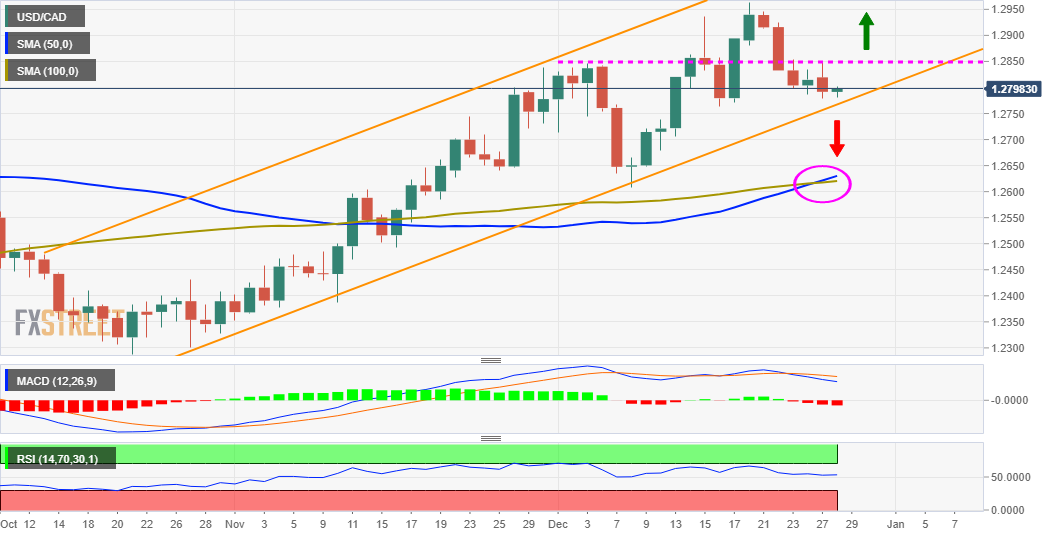
From a technical perspective, the recent corrective slide from the YTD low found a decent support near the lower boundary of an upward sloping channel extending from late October. The mentioned support is currently pegged near the 1.2770-65 region, which should now act as a pivotal point for short-term traders.
Meanwhile, technical indicators on the daily chart – though have been retreating from higher levels – are still holding in the positive territory. This, in turn, supports prospects for additional gains. That said, bullish crude oil prices might continue to underpin the commodity-linked loonie and cap the USD/CAD pair.
Hence, any subsequent positive move is more likely to confront stiff resistance near the 1.2845-50 supply zone. A sustained strength beyond will reinforce the constructive set-up and prompt some near-term short-covering rally. The USD/CAD pair could then aim back to reclaim the 1.2900 round-figure mark.
The momentum could get extended towards the recent daily closing high, near the 1.2935-40 area, en-route the YTD high, around the 1.2965 region. Some follow-through buying will be seen as a fresh trigger for bullish traders and has the potential to lift the USD/CAD pair towards the key 1.3000 psychological mark.
On the flip side, a convincing break below the trend-channel support, around the 1.2770-65 region, could prompt aggressive technical selling and accelerate the slide towards the 1.2710-1.2700 zone. The corrective fall could further get extended towards the 50/100-day SMAs confluence, currently around the 1.2625-15 region.
USD/CAD daily chart
Technical levels to watch


© 2000-2026. All rights reserved.
This site is managed by Teletrade D.J. LLC 2351 LLC 2022 (Euro House, Richmond Hill Road, Kingstown, VC0100, St. Vincent and the Grenadines).
The information on this website is for informational purposes only and does not constitute any investment advice.
The company does not serve or provide services to customers who are residents of the US, Canada, Iran, The Democratic People's Republic of Korea, Yemen and FATF blacklisted countries.
Making transactions on financial markets with marginal financial instruments opens up wide possibilities and allows investors who are willing to take risks to earn high profits, carrying a potentially high risk of losses at the same time. Therefore you should responsibly approach the issue of choosing the appropriate investment strategy, taking the available resources into account, before starting trading.
Use of the information: full or partial use of materials from this website must always be referenced to TeleTrade as the source of information. Use of the materials on the Internet must be accompanied by a hyperlink to teletrade.org. Automatic import of materials and information from this website is prohibited.
Please contact our PR department if you have any questions or need assistance at pr@teletrade.global.
transfers