- Analytics
- News and Tools
- Market News
- Gold Price Forecast: XAU/USD at inflection point pre-Fed minutes, levels to watch – Confluence Detector
Gold Price Forecast: XAU/USD at inflection point pre-Fed minutes, levels to watch – Confluence Detector
- Gold price rebounds but not out of the woods yet, Fed minutes eyed.
- Gold bears testing bullish commitments at a critical demand area.
- Gold could stage a deep correction if $1,850 becomes resistance.
Gold wilted and how? Tuesday’s tumble marked gold’s fourth straight losing streak, as bets of earlier Fed rate hikes ramped up after Fed Chair Jerome Powell’s renomination and amid pre-FOMC minutes anxiety. Heading into the US data dump and the Fed minutes later this Wednesday, gold price is licking its wounds at the critical demand area below the $1800 mark.
Read: Gold could extend slide toward $1,780 on Fed's rate outlook
Gold Price: Key levels to watch
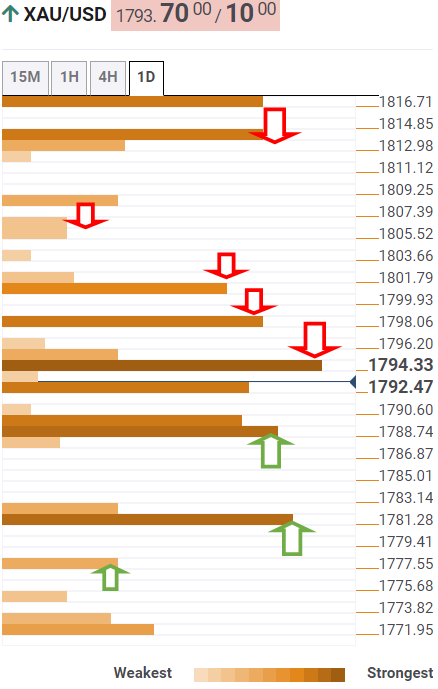
The Technical Confluences Detector shows that the gold price sees an immediate downside cushion at $1,788, where the Fibonacci 38.2% one-month coincides with the Fibonacci 23.6% one-day and SMA50 one-day.
The next stop for gold bears is seen at the previous day’s low of $1,782. Should the selling pressure intensify the bright metal would fall further towards $1,777, the pivot point one-day S1.
Alternatively, gold bulls need acceptance above the powerful $1,794 hurdle, which is the confluence of the SMA100 one-day, Fibonacci 38.2% one-day and SMA200 one-day.
Buyers will then aim for the Fibonacci 23.6% one-month at $1,798, above which the pivot point one-week S3 at $1,800 could be in play.
On buying resurgence, the intersection of the SMA10 and SMA200 on four-hour at $1,806 will challenge the upside.
A firm break above the latter will fuel a fresh rally towards the previous month’s high of $1,814.
Here is how it looks on the tool
About Technical Confluences Detector
The TCD (Technical Confluences Detector) is a tool to locate and point out those price levels where there is a congestion of indicators, moving averages, Fibonacci levels, Pivot Points, etc. If you are a short-term trader, you will find entry points for counter-trend strategies and hunt a few points at a time. If you are a medium-to-long-term trader, this tool will allow you to know in advance the price levels where a medium-to-long-term trend may stop and rest, where to unwind positions, or where to increase your position size.


© 2000-2026. All rights reserved.
This site is managed by Teletrade D.J. LLC 2351 LLC 2022 (Euro House, Richmond Hill Road, Kingstown, VC0100, St. Vincent and the Grenadines).
The information on this website is for informational purposes only and does not constitute any investment advice.
The company does not serve or provide services to customers who are residents of the US, Canada, Iran, The Democratic People's Republic of Korea, Yemen and FATF blacklisted countries.
Making transactions on financial markets with marginal financial instruments opens up wide possibilities and allows investors who are willing to take risks to earn high profits, carrying a potentially high risk of losses at the same time. Therefore you should responsibly approach the issue of choosing the appropriate investment strategy, taking the available resources into account, before starting trading.
Use of the information: full or partial use of materials from this website must always be referenced to TeleTrade as the source of information. Use of the materials on the Internet must be accompanied by a hyperlink to teletrade.org. Automatic import of materials and information from this website is prohibited.
Please contact our PR department if you have any questions or need assistance at pr@teletrade.global.
transfers