- Analytics
- News and Tools
- Market News
- Gold Price Forecast: Battle lines well-defined for XAU/USD, with eyes on Fed, yields – Confluence Detector
Gold Price Forecast: Battle lines well-defined for XAU/USD, with eyes on Fed, yields – Confluence Detector
- Gold price rebounds but not out of the woods yet, focus on yields.
- Gold bull-bear tug-of-war likely to unfold ahead of Fed minutes.
- Gold could stage a deep correction if $1,850 becomes resistance.
Gold is looking to snap its three-day downtrend, attempting a bounce above the $1,800 mark amid a minor pullback in the US Treasury yields. A corrective upside in gold price cannot be ruled out ahead of Wednesday’s US data dump and FOMC minutes, as markets reposition after the biggest daily loss incurred since mid-September.
Gold price tumbled 2% on Monday after Jerome Powell’s renomination as the Fed Chair triggered a sharp rally in the US Treasury yields on expectations of a faster pace of Fed’s tapering.
Read: Gold Price Forecast: XAU/USD eyes dead cat bounce towards $1,830 amid oversold RSI, focus on yields
Gold Price: Key levels to watch
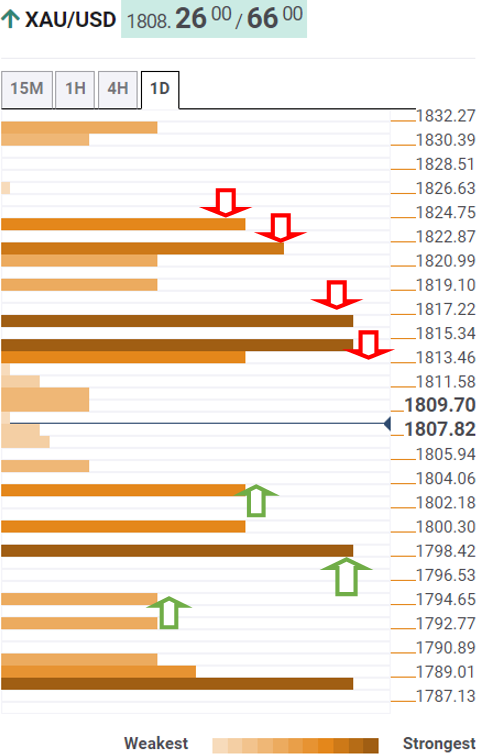
The Technical Confluences Detector shows that the gold price is retreating towards the previous day’s low of $1,802.
The psychological $1,800 threshold will gain the sellers’ attention on a sustained move lower. At that level, the pivot point one-week S3 coincides.
The Fibonacci 23.6% one-month at $1,798 will be a tough nut to crack for gold bears.
If that caves in, then powerful support around $1,793 will challenge the bullish commitments. That point is the intersection of the SMA100 and SMA200 one-day.
Alternatively, stiff resistance is seen around $1,814, which is the convergence of the previous month’s high, Fibonacci 23.6% one-day and Bollinger Band four-hour Lower.
Acceptance above the latter will threaten the immediate cap at $1,817, the pivot point one-month R1.
The next significant upside barrier is envisioned at $1,821, the confluence of the pivot point one-week S2 and Fibonacci 38.2% one-day.
Here is how it looks on the tool
About Technical Confluences Detector
The TCD (Technical Confluences Detector) is a tool to locate and point out those price levels where there is a congestion of indicators, moving averages, Fibonacci levels, Pivot Points, etc. If you are a short-term trader, you will find entry points for counter-trend strategies and hunt a few points at a time. If you are a medium-to-long-term trader, this tool will allow you to know in advance the price levels where a medium-to-long-term trend may stop and rest, where to unwind positions, or where to increase your position size.


© 2000-2026. All rights reserved.
This site is managed by Teletrade D.J. LLC 2351 LLC 2022 (Euro House, Richmond Hill Road, Kingstown, VC0100, St. Vincent and the Grenadines).
The information on this website is for informational purposes only and does not constitute any investment advice.
The company does not serve or provide services to customers who are residents of the US, Canada, Iran, The Democratic People's Republic of Korea, Yemen and FATF blacklisted countries.
Making transactions on financial markets with marginal financial instruments opens up wide possibilities and allows investors who are willing to take risks to earn high profits, carrying a potentially high risk of losses at the same time. Therefore you should responsibly approach the issue of choosing the appropriate investment strategy, taking the available resources into account, before starting trading.
Use of the information: full or partial use of materials from this website must always be referenced to TeleTrade as the source of information. Use of the materials on the Internet must be accompanied by a hyperlink to teletrade.org. Automatic import of materials and information from this website is prohibited.
Please contact our PR department if you have any questions or need assistance at pr@teletrade.global.
transfers