- Analytics
- News and Tools
- Market News
- Gold Price Forecast: XAU/USD remains exposed to downside risks, $1,834 eyed – Confluence Detector
Gold Price Forecast: XAU/USD remains exposed to downside risks, $1,834 eyed – Confluence Detector
- Gold price bounces from two-week lows but firmer DXY, yields weigh.
- Gold bears keep their sight on $1,834 after breaching $1,850 on Friday.
- Gold could stage a deep correction if $1,850 becomes resistance.
Gold is struggling to find its feet on Monday, having hit the lowest levels in two weeks at $1,839 on Friday. The US dollar holds onto the recent gains, despite the improving market mood, as the Treasury yields rebound amid expectations of hastened Fed’s tapering. Given this scenario, gold remains vulnerable to additional downside momentum. Although bears could catch a breather ahead of Wednesday’s US data dump and FOMC minutes.
Read: Gold, Chart of the Week: Bears eye the 38.2% Fibonacci for the open
Gold Price: Key levels to watch
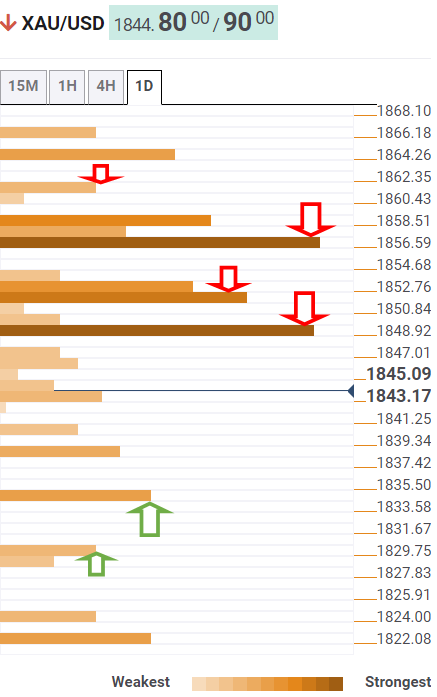
The Technical Confluences Detector shows that the gold price recovery remains capped below a powerful resistance at $1,848, which is the intersection of the Fibonacci 23.6% one-day and pivot point one-month R2.
The next upside target for gold bulls is seen at $1,852, where the Fibonacci 23.6% one-week, Fibonacci 38.2% one-day and SMA10 one-day coincide.
Strong resistance at $1,857 will then challenge the bearish commitments. That level is the confluence of the Fibonacci 61.8% one-day, Fibonacci 38.2% one-week and SMA5 one-day.
The pivot point one-day R1 at $1,861 will be the last resort for gold sellers.
Alternatively, a sustained break below the intraday low of $1,839, will call for a fresh decline towards the pivot point one-week S1 at $1,834.
The relevant support is seen at $1,829, the convergence of the pivot point one-day S2 and SMA100 four-hour.
Here is how it looks on the tool
About Technical Confluences Detector
The TCD (Technical Confluences Detector) is a tool to locate and point out those price levels where there is a congestion of indicators, moving averages, Fibonacci levels, Pivot Points, etc. If you are a short-term trader, you will find entry points for counter-trend strategies and hunt a few points at a time. If you are a medium-to-long-term trader, this tool will allow you to know in advance the price levels where a medium-to-long-term trend may stop and rest, where to unwind positions, or where to increase your position size.


© 2000-2026. All rights reserved.
This site is managed by Teletrade D.J. LLC 2351 LLC 2022 (Euro House, Richmond Hill Road, Kingstown, VC0100, St. Vincent and the Grenadines).
The information on this website is for informational purposes only and does not constitute any investment advice.
The company does not serve or provide services to customers who are residents of the US, Canada, Iran, The Democratic People's Republic of Korea, Yemen and FATF blacklisted countries.
Making transactions on financial markets with marginal financial instruments opens up wide possibilities and allows investors who are willing to take risks to earn high profits, carrying a potentially high risk of losses at the same time. Therefore you should responsibly approach the issue of choosing the appropriate investment strategy, taking the available resources into account, before starting trading.
Use of the information: full or partial use of materials from this website must always be referenced to TeleTrade as the source of information. Use of the materials on the Internet must be accompanied by a hyperlink to teletrade.org. Automatic import of materials and information from this website is prohibited.
Please contact our PR department if you have any questions or need assistance at pr@teletrade.global.
transfers